NiftyToday on daily time frame new life time high with inverted candles.
Important support 22900 to 22750 and resistance 23250.
We may test 23250 in next week.
Market indices

my opinion about nasdaq or us100My opinion there’s big bearish for next week so if the price go to that zone you can sell it

US 30 short - scalp trade Taken a nice small short scalp on US 30 to finish the week.
Entry 39137
TP 39114
SL 39157
Entered on the break of the lows on the 1min targeting the imbalance.
As long as we do not break and close above 39195 expect lower pa targeting the HTF sellside sitting around 39030
IF we break above 39195 we will continue higher toward yesterday's buyside liquidity
Noted the 15min breaker (blue box) which should be your main point of reference before trying to find entries on the LTF
Hope you guys have a great week and made the best out of every single day. Hoping you gained some better insight into your trading and that you've learned more about your system and yourself throughout this week. As always... regardless of your bottom line for the week (ending green or red)... this is just one week in the many more to come in your trading journey...don't fall for the illusion of achievement or failure...we LEARN AND GROW EVERY SINGLE DAY
Stay safe and never risk more than 1-5% of your capital per trade. The following analysis is merely a price action based analysis and does not constitute financial advice in any form.

NIFTY DAILY - 24/5/2024Nifty opens lower and made day low which is 22908 level, afterwards bulls drag the market upside and made All Time High that is 23026 level.
Nifty was highly volatile throughout the trading session, Nifty traded in between +50 points to -50 points for whole day.
Index has formed green body candle with long upper shadow which indicates seller were selling from days high.
Candle is trading at upper band of Bollinger Band.
Nifty is able to hold 22900 so, further resistance can be 23059 level with support of 22716 level.
Bank Nifty levels
Support – 48677
Resistance – 49334
Today’s Advance Decline ratio of NIFTY50
Advance - 17
Decline - 32 Unchanged – 1
FII Sell – 944.83 crores
DII Buy + 2320.32 crores.
⚠️ Important: Always maintain your Risk & Reward Ratio.
✅Like and follow to never miss a new idea!✅
Disclaimer: I am not SEBI Registered Advisor. My posts are purely for training and educational purposes.
Eat🍜 Sleep😴 TradingView📈 Repeat 🔁
Happy learning with trading. Cheers!🥂

NIFTY: Trading Plan for 24-May-2024
After the impressive movement we saw on Thursday, 23 May 2024, where prices hit our targets precisely, we might expect a more relaxed trading session on Friday, 24-May-2024. However, we should be ready for various scenarios. Here’s our plan:
Gap Up Opening
Above 23000: If prices open above 23000, they might face resistance near 23059 and trade sideways.
Above 23060: Prices can rise towards 23142.
Below 23000: Prices might find support at 22917-22897.
Below 22880: Look for support at 22803-22800.
Flat Opening
Support at 22915-22897: If prices open flat, they might first take support here.
Upside: After finding support, prices can move towards 23000-23059.
Below 22880: If this support fails, prices could drop towards 22800.
Gap Down Opening
Below 22880: If prices open below this level and stay there for the first hour, expect a drop towards 22800.
Recovery above 22915: If prices quickly recover above 22915, look for a move towards 23000-23059.
Conclusion: While a sideways session is likely, be prepared for quick movements in either direction based on these key levels.
Disclaimer: Trading involves risk, and past performance is not indicative of future results. Make trading decisions based on your own analysis and risk tolerance.

BANKNIFTY: Trading Plan for 24-May-2024After the excitement in BANKNIFTY on Thursday, we expect a quieter session on Friday, 24-May-2024. Here’s how to navigate different opening scenarios:
Gap Up Opening
Above 48850: If prices open above this level and sustain for the first hour, they can move up to 49000-49080.
Below 48760: If prices can't sustain above 48850 and drop below 48760, expect sideways trading between 48760-48602.
Below 48550: A drop below this level can push prices towards 48417, which should act as support.
Flat Opening
Near 48700: If prices open flat around this level, expect sideways movement between 48760-48600.
Above 48860: Sustained trading above this level can lead to 49000-49080, and potentially towards 49316.
Below 48600: Sustained trading below this level can cause a retracement to 48417-48400.
Gap Down Opening
Below 48600: If prices open below this level and stay there for the first hour, expect a drop towards 48400 and possibly 48260.
Recovery above 48600: Quick recovery above 48600 might lead to sideways trading between 48600-48760.
Above 48760: Prices could then aim for 49000-49080.
Conclusion: Although a quieter session is anticipated, stay alert for movements based on these key levels.
Disclaimer: Trading involves risk, and past performance is not indicative of future results. Make trading decisions based on your own analysis and risk tolerance.

STOP asking this dangerous two word questionWhat if?
This simple two word question is a psychological trap that traders often encounter.
And it does nothing more than undermine their decision-making process and overall trading performance.
This question will open a box of doubts, hypotheticals, and second-guessing.
This can paralyze action, distort risk assessment, and divert focus from the present to an endless maze of unrealized possibilities.
Let’s look into the psychological effects and what you can do to stop it from creeping in.
Psychological Impact
#1: Doubt and Hesitation
Constantly questioning “What if?” introduces doubt into the decision-making process.
For traders, you need to make decisions quickly and with confidence.
If you have any hesitation when you take a trade, it can lead to missed opportunities or entering positions at less than optimal prices.
#2: Fear of Missing Out (FOMO)
“What if this stock skyrockets after I sell?”
“What if this stock isn’t ideal?”
What if this trade hits my stop loss?”
This type of questioning can lead to either:
~ Holding positions too long.
~ Not holding positions long enough.
~ Not taking the trade.
~ Or missing great opportunities that come your way.
#3: Overtrading
Conversely, the fear of missing out can also lead to overtrading.
“What if this is the next big opportunity?”
Regardless on whether the trade lined up or not.
You might be compelled to jump into trades without proper analysis or strategy.
This will increase your trades, costs and your exposure to risk.
#4: Regret and Rumination
Traders who focus on “What if?” scenarios may dwell on past decisions, and this could lead to regret and rumination.
This backward-looking perspective can hinder the ability to learn from mistakes and make more informed decisions in the future.
So let’s try prevent the WHAT IF? Scenario.
Don’t you think?
Managing “What If?” in Trading
#1: Develop a Trading Plan
Make sure you have a clear, well-thought-out trading plan.
This will help you to minimise second-guessing.
If you have pre-defined entry, exit, and risk management rules in advance, you’ll be able to reduce the temptation to ask “What if?” and instead focus on executing your strategy.
#2: Embrace Risk Management
When you understand and accept the inherent risks of trading can alleviate the stress of “What if?” questions.
Effective risk management will help ensure you to prepare for all types of outcomes.
And you’ll handle your losses without deviating from your strategy.
#3: Stay Present
You need to be in the NOW moment.
This way you’ll be able to avoid the trap of hypotheticals.
Ask the questions:
Has my trading system aligned?
What is my daily and weekly bias?
#4: Accept Uncertainty
Recognise that market conditions are inherently unpredictable as I’ve mentioned many times.
The only thing you should have your mind set to are the probabilities and possibilities of trades lining up.
No outcomes can be foreseen or controlled.
All you can do is follow your strategy accordingly and forget about the prompt “WHAT IF?”.
Final words:
I think I have covered all the ways you need to stop worrying about the unknown.
You need to stop asking “WHAT IF?”. And start saying “NOW DO”.
Let’s sum up why we would ask the hypothetical question when we trade:
#1: Doubt and Hesitation
#2: Fear of Missing Out (FOMO)
#3: Overtrading
#4: Regret and Rumination
Managing “What If?” in Trading
#1: Develop a Trading Plan
#2: Embrace Risk Management
#3: Stay Present
#4: Accept Uncertainty

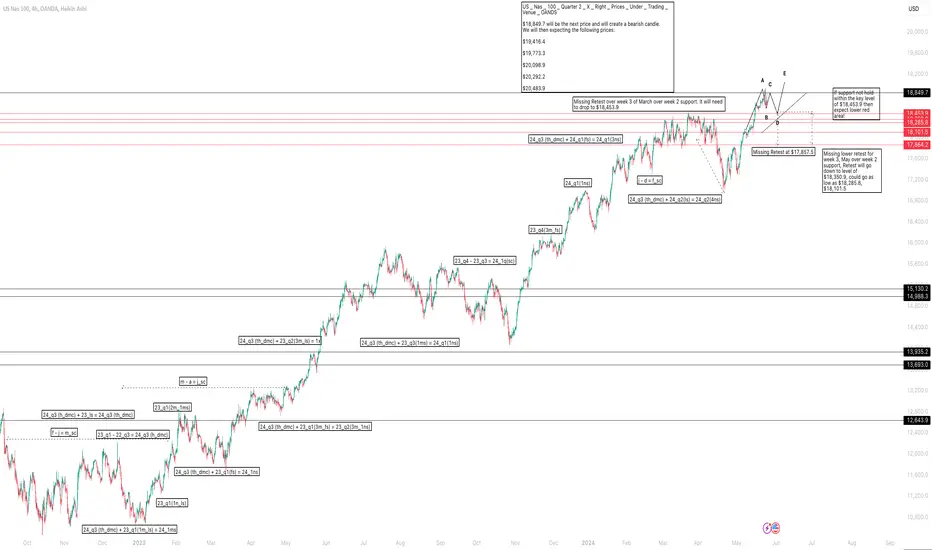
US _ Nas _ 100 _ Quarter 2 _ X _ Right _ Prices _ Under _ TradinUS _ Nas _ 100 _ Quarter 2 _ X _ Right _ Prices _ Under _ Trading _ Venue _ OANDS
$18,849.7 will be the next price and will create a bearish candle.
We will then expecting the following prices:
$19,416.4
$19,773.3
$20,098.9
$20,292.2
$20,483.9
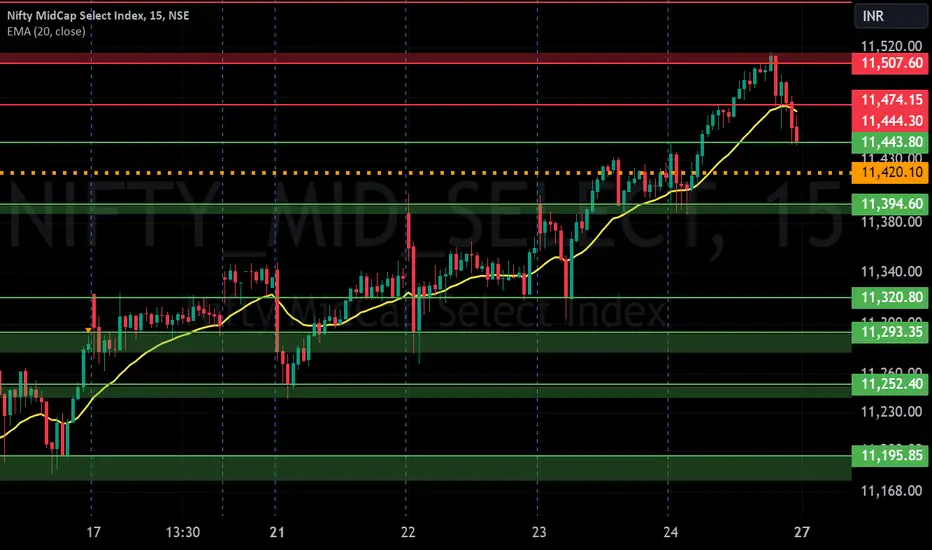
NIFTY MIDCAP S/R for 27/5/24Support and Resistance Levels: In technical analysis, support and resistance levels are significant price levels where buying or selling interest tends to be strong. They are identified based on previous price levels where the price has shown a tendency to reverse or find support.
Support levels are represented by the green line and green shade, indicating areas where buying interest may emerge to prevent further price decline.
Resistance levels are represented by the red line and red shade, indicating areas where selling pressure may arise to prevent further price increases. Traders often consider these levels as potential buying or selling opportunities.
Breakouts: Breakouts occur when the price convincingly moves above a resistance level (red shade) or below a support level (green shade). A bullish breakout above resistance suggests the potential for further price increases, while a bearish breakout below support suggests the potential for further price declines. Traders pay attention to these breakout signals as they may indicate the start of a new trend or significant price movement.
Disclosure: I am not SEBI registered. The information provided here is for learning purposes only and should not be interpreted as financial advice. It is important to consult with a qualified financial advisor before making any investment decisions. Tweets neither advice nor endorsement.
FIN NIFTY S/R for 27/5/24Support and Resistance Levels: In technical analysis, support and resistance levels are significant price levels where buying or selling interest tends to be strong. They are identified based on previous price levels where the price has shown a tendency to reverse or find support.
Support levels are represented by the green line and green shade, indicating areas where buying interest may emerge to prevent further price decline.
Resistance levels are represented by the red line and red shade, indicating areas where selling pressure may arise to prevent further price increases. Traders often consider these levels as potential buying or selling opportunities.
Breakouts: Breakouts occur when the price convincingly moves above a resistance level (red shade) or below a support level (green shade). A bullish breakout above resistance suggests the potential for further price increases, while a bearish breakout below support suggests the potential for further price declines. Traders pay attention to these breakout signals as they may indicate the start of a new trend or significant price movement.
Disclosure: I am not SEBI registered. The information provided here is for learning purposes only and should not be interpreted as financial advice. It is important to consult with a qualified financial advisor before making any investment decisions. Tweets neither advice nor endorsement.

BANK NIFTY S/R for 27/5/24Support and Resistance Levels: In technical analysis, support and resistance levels are significant price levels where buying or selling interest tends to be strong. They are identified based on previous price levels where the price has shown a tendency to reverse or find support.
Support levels are represented by the green line and green shade, indicating areas where buying interest may emerge to prevent further price decline.
Resistance levels are represented by the red line and red shade, indicating areas where selling pressure may arise to prevent further price increases. Traders often consider these levels as potential buying or selling opportunities.
Breakouts: Breakouts occur when the price convincingly moves above a resistance level (red shade) or below a support level (green shade). A bullish breakout above resistance suggests the potential for further price increases, while a bearish breakout below support suggests the potential for further price declines. Traders pay attention to these breakout signals as they may indicate the start of a new trend or significant price movement.
Disclosure: I am not SEBI registered. The information provided here is for learning purposes only and should not be interpreted as financial advice. It is important to consult with a qualified financial advisor before making any investment decisions. Tweets neither advice nor endorsement.

NIFTY S/R for 27/5/24Support and Resistance Levels: In technical analysis, support and resistance levels are significant price levels where buying or selling interest tends to be strong. They are identified based on previous price levels where the price has shown a tendency to reverse or find support.
Support levels are represented by the green line and green shade, indicating areas where buying interest may emerge to prevent further price decline.
Resistance levels are represented by the red line and red shade, indicating areas where selling pressure may arise to prevent further price increases. Traders often consider these levels as potential buying or selling opportunities.
Breakouts: Breakouts occur when the price convincingly moves above a resistance level (red shade) or below a support level (green shade). A bullish breakout above resistance suggests the potential for further price increases, while a bearish breakout below support suggests the potential for further price declines. Traders pay attention to these breakout signals as they may indicate the start of a new trend or significant price movement.
Disclosure: I am not SEBI registered. The information provided here is for learning purposes only and should not be interpreted as financial advice. It is important to consult with a qualified financial advisor before making any investment decisions. Tweets neither advice nor endorsement.

$DJI warnings signs but not all is darkGood Morning!!!
Let's dissect a few things.
The DJ:DJI is showing warning signs on the Weekly Chart:
Money has been leaving.
Harder to see on a daily so showing on weekly.
RSI is also weak.
Daily
The DOW is trading under shorter term moving avgs.
The RSI is at an important juncture, 50.
$ flow almost under 0.
-----------------------
There are some positives to the DJ:DJI :
There is an Inverse head & shoulder pattern. Although this pattern is better @ calling lows. Of course, if it holds the 38.5k Support Level.
37.5k & 37k would be the next support areas before the retest of the MAJOR SUPPORT level, which is the old all time highs.
Sell in May go away?
Still bullish but weak spot for the average.

DXY Expected moveThis is the move we expect to happen today and maybe continue even tomorrow on the DXY

Swing watch: Retrace to 50% fib, look for reactionOn the weekly, price seems to be retracing on the daily bullish range. I am waiting for a reaction on the 50% fib to determine if it will reverse to the upside from there or continue lower to take out the weekly FL/sell side liquidity.
On the hourly, I am looking price to retrace upside on the bearish range to test 50% fib, for a reaction to continue upside or impulse downside to that daily 50% fib I mentioned earlier.

NasdaqPrice gave very good movement, nearly 300 points yesterday and now it is at crucial zone. 18600 is important in deciding the trend direction.
Buy above 18630 with the stop loss of 19590 for the targets 18660, 18700, 18740 and 18800.
Sell below 18550 with the stop loss of 18590 for the targets 18510, 18480, 18440 and 18400.
!8500 can act as support.
Hit the like button to Rock !! Show some energy !!
Note : This is my pre market analysis and my trading journal. Not a suggestion to buy or sell.
You are responsible for whatever you do.

Nifty What ifs? it is 2004 again / seats are close to 400. Last phases of election are going on the result will be declared on 4th June the talk of the town is what will happen to Nifty if election is won by someone who is expected to win the general elections in India and what will happen if the results are unexpected. We can not predict elections and we can not predict how the Nifty will behave but certainly the charts which are representations of human emotions tell us a story and give us projections which we have seen are very close to being accurate. We have taken the help of Fibonacci retracement and parallel channel to help us understand where human emotions can lead Nifty to.
Scenario 1) 2004 (History repeats itself)(Thunder seldom strikes twice in the same place but what if?)
Let us talk about unexpected scenario like what happened in 2004. In this case market will definitely market will take a hit. The support levels for Nifty in such a case will be 20391. 20391 happens to be our channel bottom additionally it is also a Fibonacci support.
If the Nifty falls below 20391 which it potentially can as investor emotions rather than valuations will take precedence the next support will be at 18688. In case 18688 will not hold (which is unlikely) worst case scenario as of now is Mother line support 50 Months EMA is at 17358. (This is what chart tells me as of now). In case of hung parliament / policy paralysis / War like situation at border and major internal strife Nifty may even fall to 15471.)
In short there will be a lot of wealth erosion initially but nevertheless market will stabilize and upward journey will definitely begin once again if the euphoria of loss settles down. As companies will adjust / adapt and keep performing. The show will go on. When Trump lost US experts were saying that US market will have a free fall but against all odds US markets saw new highs in Biden term. Always remember that markets are unpredictable.
Scenario 2) Seats are close to 350 or 400.
The Euphoria and mad valuations in some stock might continue for a while but surely there will be Profit Booking fall sooner than later. The Major Nifty Resistance is near 23608 which also happens to be a mid channel resistance. That can be a potential point of profit booking. If we get a closing above 23608 which is less likely in near term, but you never say never. Or whenever in future we get a closing above 23608. This will open the doors for long term target of 27K. In 4/5 years time the best case scenario seems to be Nifty between 27 and 30K.
Scenario 3) Seats are between 250 and 300. It will be victory or close to victory nevertheless it has potential to damage emotions of the investors and profit booking cycle can begin right then and there. 21376 or 20391 is possible even in such a scenario. Eventually when dust will settle and valuations are affordable again Nifty will restart it's journey towards 23608 in this case.
I hope that the above Technical analysis will help you in bracing yourself for impact on D-day that is 4th June. Even if the landing is going to be smooth airlines always asks us to wear seat belts. In cars also we wear seat belts for safety. On bike we are supposed to wear helmets. What are all these equipment for? Safety.
Safety mechanism of Stock market is Stop loss and Trailing stop loss. Keep them in a proper place whether it is scenario 1, 2 or 3. It will save you in case of scenario 1 or 3. Incase it is scenario 2 some of your stop losses may be hit and then the stock will run upward but remember it will be loss in profit. Loss in profit is better than loss. No one in the world has become a pauper by keeping stop losses.
Disclaimer: There is a chance of biases including confirmation bias, information bias, halo effect and anchoring bias in this write-up. Investment in stocks, derivatives and mutual funds is subject to market risks, please consult your investment advisor before taking financial decisions. The data, chart and other information provided above is for the purpose of analysis and is purely educational in nature. The names of the stocks or index levels of spot Nifty mentioned in the article are for the purpose of education and analysis only. Purpose of this article is educational. Please do not consider this as a recommendation of any sorts.

Learn from the Pros: Trading Quotes from Trading LegendsSpeculation is as old as the hills, says one of the world’s best traders of all time, Jesse Livermore. In this blog, we give you the best quotes by the best traders — use them to get inspired and realize that success in trading is possible.
Paul Tudor Jones, hedge fund manager, founder of Tudor :
“I always believe that prices move first and fundamentals come second.”
“If I have positions going against me, I get right out; if they are going for me, I keep them. Risk control is the most important thing in trading.”
“I believe the very best money is made at the market turns. Everyone says you get killed trying to pick tops and bottoms and you make all your money by playing the trend in the middle. Well for twelve years I have been missing the meat in the middle but I have made a lot of money at tops and bottoms.”
Stanley Druckenmiller, family office manager, founder of Duquesne:
“I don't really like hedging. To me, if something needs to be hedged, you shouldn't have a position in it.”
“I like putting all my eggs in one basket and then watching the basket very carefully.”
“Soros has taught me that when you have tremendous conviction on a trade, you have to go for the jugular. It takes courage to be a pig. It takes courage to ride a profit with huge leverage.”
George Soros, hedge fund manager, founder of Soros Fund Management :
“It's not whether you're right or wrong, but how much money you make when you're right and how much you lose when you're wrong.”
“Markets are constantly in a state of uncertainty and flux and money is made by discounting the obvious and betting on the unexpected.”
“My peculiarity is that I don't have a particular style of investing or, more exactly, I try to change my style to fit the conditions.”
Ray Dalio, hedge fund manager, founder of Bridgewater Associates :
“In trading you have to be defensive and aggressive at the same time. If you are not aggressive, you are not going to make money, and if you are not defensive, you are not going to keep money.”
“Diversifying well is the most important thing you need to do in order to invest well.”
“To make money in the markets, you have to think independently and be humble.”
Jesse Livermore, stock trader, portrayed in “Reminiscences of a Stock Operator”:
“It never was my thinking that made the big money for me. It was always my sitting.”
“It is literally true that millions come easier to a trader after he knows how to trade, than hundreds did in the days of his ignorance.”
“There is nothing new on Wall Street. There can’t be because speculation is as old as the hills. Whatever happens in the stock market today has happened before and will happen again.”
Let’s hear from you!
What’s your favorite trading quote or maybe a favorite trader? Let us know in the comments!

Commodities on the rise, but can they pull back?Commodities have been in a bull run since 2020, within an uptrend that can resume after the pullback observed in 2022. Analyzing the CRB Commodity Index, I believe that the pullback from that recent 2022 high isn’t over yet. There’s potential for a C wave that could retrace to 38.2% of the 2020 bull run. This may suggests that inflation might cool down, but much depends on the Federal Reserve’s rate decisions. Premature rate cuts could spur demand and drive prices higher, complicating the inflation scenario.

SP500 Short trading opportunity(swing-trading) 1I expect a swing of about 70 points+- all the way down to 5200
The USA Federal Reserve has indicated that it won't be cutting interest rates anytime soon, I think this was a bit unexpected and not entirely priced in before so we should see some decline of the value of the SP500 Index.
However I can assume only short term, don't know the longer term implications of this that is why I am only aiming for a small downtrend at the very least.
Stop Loss 5295+- (or 5305+-), take profit is 5200+-.
I am risking $27500+- dollars in a Short Position, I will lose $100+- if it hits the stop loss and make around $465 if it hits my take profit.

7 DTE on SPX (Mar 30th expiry)Selling my wings at the 10 delta this time.
-5215 +5205 / -5395 +5405
Mar 30th Expiry
150 Premium - 7.13 commission & fees
850 Allocated capital
16.81% gain on capital

Nasdaq buyNasdaq signal already running 100 pips profit from our entry point ... buy trend line breaked but this is correction momentum so break even trade safe

NAS Retracement possibleWe're pretty close to the midnight line, but there could be a retracement back toward the NYC Midnight opening price.
Looking for one more rejection with the top price zone.
