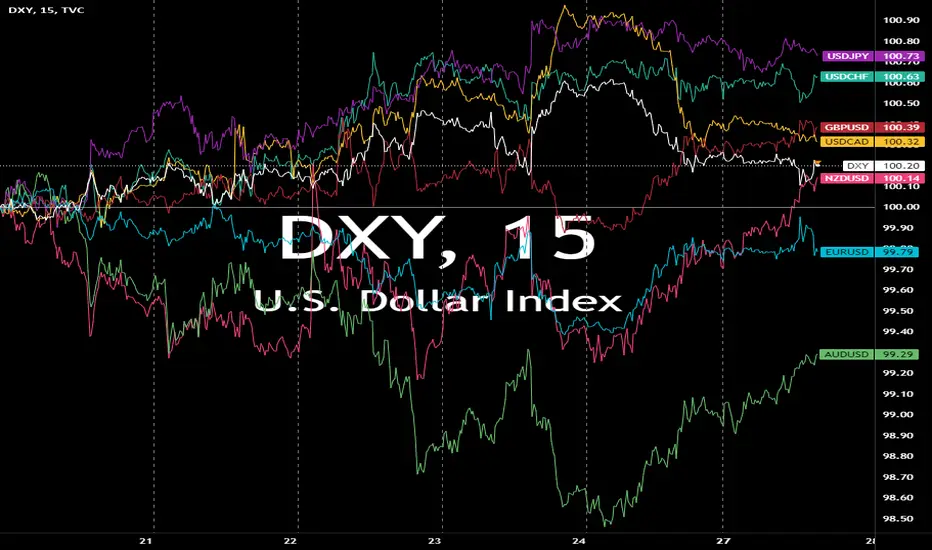
For pure charting enthusiasts.
This is a beautiful chart. When we filter time out of the analysis, the price action becomes clearer.
Market indices

Is King Dollar poised for a flush ?Possible H&S formation on the DXY.
These formations do not always work out....
But interesting to watch since it would have profound implications on Crypto Assets and Prescious Metals Mining companies....
I am bullish on all the above, especially on PM since the Gold / Silver ratio recently had a major break down.

BANKNIFTY Tomorrow Intraday LevelsTrade plan for tomorrow. BNAKNIFTY important/Intraday levels.
No Price Action
No Support and Resistance
No Indicators
No Moving Averages
Not Gann levels These levels are purely based on mathematics.
If it is useful please give your comment.

Bearish DXYMonthly:
1. Direction:
Bearish
2. Reasons:
1. price is respecting OB.
2. A good Displacement
Weekly:
1. Direction:
Bearish
2. Reasons:
1. Price disrespected Bullish FVG
2. BOS with massive displacement
3. price is moving from ERL to IRL
Daily:
1. Direction:
Bearish
2. Reasons:
1. bearish orderflow
2. Respected the daily FVG
3. Good displacement
4H:
1. Direction:
Bearish
2. Reasons:
1. MMSM formation
2. FVG formations
3. BOS with displacement

DOLLAR BULLISH???!!!!! Dollar retested from the Day Trendline1.According to my view dollar reached its Target and retested from Day Trendline Liquidity and the Support Zone.
2.If its broke the Resistance and upper Trendline then it'll reach the major resistance zone.
3.If Dollar broke the current support zone then it'll reach the next support around 103.000.
4.Day 200 EMA retested well.

US30 Alert: Key Sell Opportunity and Potential Bullish Surge!Greetings Traders!
Brief Description🖊️:
Today, I am focusing on trading the US30, with an interest in taking a selling opportunity to reach the H4 bullish order block.
Things I Have Seen👀:
Liquidity Engineering🔄: Currently, price is engineering liquidity right above the H4 bullish order block using a retail pattern (support zone).
Confirmation Buy Zone🟢: Once the price reaches the H4 bullish order block, I will look to buy against the sell stops (stop losses) upon confirmation.
Bullish Targets📈:
-1st Objective (H1 Buy Stops): Anticipating price having to reach into the H1 buy stops, which is high probable.
-2nd Objective (Daily FVG): Anticipating a minor bullish run to reach and potentially fill the DAILY timeframe Fair Value Gap (FVG).
What's Important Now❗
Time is crucial. I only trade indices during the New York session morning and afternoon due to the favorable volatility. Stay observant for real-time developments.
Stay tuned for a video analysis on the US30.
Best Regards,
The_Architect


NASDAQ 4H OUTLOOKNASDAQ 4H TIMEFRAME
1. Trend and Structure
• Current High and Monthly Resistance:
The NASDAQ is currently at a high of 18950.0, facing monthly resistance, which is indicated by a bearish candlestick.
• Monthly Support Levels: The index has broken above the 18390.3 level, which is a significant monthly support level.
2. Support and Resistance Levels
• Monthly Resistance: 18950.0
• Monthly Support: 18390.3
3. Trendlines and Patterns
• Supporting Trendline: The trendline indicates a bullish structure.
• Potential Reversal Zone: Watch the yellow zone for a possible M pattern (double top) formation, suggesting a potential reversal if confirmed.
Conclusion
• Current Bearish Signal: The bearish candlestick at the 18950.0 resistance indicates selling pressure.
• Key Levels: Monitor reactions at the 18390.3 support and the potential M pattern formation in the yellow zone for possible reversal signals.

US Nas_ 100 _ Update _ Prices _ Under _ Trading _ Venue _ OANDAUS Nas_ 100 _ Update _ Prices _ Under _ Trading _ Venue _ OANDA
The retest was pretty much useless as it did not finish the correct area.
We will still expecting drop to the red area after the support confirmation:
Support confirmation over week 4, May:
$18,954.8.
Then will need to drop to the red area, even if go to the higher prices still must come own to finish the correct retest.
Once the retest is done we will be expecting following prices:
$19,096.5
$19,165.6
$19,195.7
$19,231.1
$19,250.6
$19,282.5
$19,296.7
$19,341.0
Distribution price: $19,358.7.
Market from here will take a short break.

SENSEX S/R for 28/5/24Support and Resistance Levels: In technical analysis, support and resistance levels are significant price levels where buying or selling interest tends to be strong. They are identified based on previous price levels where the price has shown a tendency to reverse or find support.
Support levels are represented by the green line and green shade, indicating areas where buying interest may emerge to prevent further price decline.
Resistance levels are represented by the red line and red shade, indicating areas where selling pressure may arise to prevent further price increases. Traders often consider these levels as potential buying or selling opportunities.
Breakouts: Breakouts occur when the price convincingly moves above a resistance level (red shade) or below a support level (green shade). A bullish breakout above resistance suggests the potential for further price increases, while a bearish breakout below support suggests the potential for further price declines. Traders pay attention to these breakout signals as they may indicate the start of a new trend or significant price movement.
Disclosure: I am not SEBI registered. The information provided here is for learning purposes only and should not be interpreted as financial advice. It is important to consult with a qualified financial advisor before making any investment decisions. Tweets neither advice nor endorsement.

FIN NIFTY S/R for 28/5/24Support and Resistance Levels: In technical analysis, support and resistance levels are significant price levels where buying or selling interest tends to be strong. They are identified based on previous price levels where the price has shown a tendency to reverse or find support.
Support levels are represented by the green line and green shade, indicating areas where buying interest may emerge to prevent further price decline.
Resistance levels are represented by the red line and red shade, indicating areas where selling pressure may arise to prevent further price increases. Traders often consider these levels as potential buying or selling opportunities.
Breakouts: Breakouts occur when the price convincingly moves above a resistance level (red shade) or below a support level (green shade). A bullish breakout above resistance suggests the potential for further price increases, while a bearish breakout below support suggests the potential for further price declines. Traders pay attention to these breakout signals as they may indicate the start of a new trend or significant price movement.
Disclosure: I am not SEBI registered. The information provided here is for learning purposes only and should not be interpreted as financial advice. It is important to consult with a qualified financial advisor before making any investment decisions. Tweets neither advice nor endorsement.

BANK NIFTY S/R for 28/5/24Support and Resistance Levels: In technical analysis, support and resistance levels are significant price levels where buying or selling interest tends to be strong. They are identified based on previous price levels where the price has shown a tendency to reverse or find support.
Support levels are represented by the green line and green shade, indicating areas where buying interest may emerge to prevent further price decline.
Resistance levels are represented by the red line and red shade, indicating areas where selling pressure may arise to prevent further price increases. Traders often consider these levels as potential buying or selling opportunities.
Breakouts: Breakouts occur when the price convincingly moves above a resistance level (red shade) or below a support level (green shade). A bullish breakout above resistance suggests the potential for further price increases, while a bearish breakout below support suggests the potential for further price declines. Traders pay attention to these breakout signals as they may indicate the start of a new trend or significant price movement.
Disclosure: I am not SEBI registered. The information provided here is for learning purposes only and should not be interpreted as financial advice. It is important to consult with a qualified financial advisor before making any investment decisions. Tweets neither advice nor endorsement.

NIFTY S/R for 28/5/24Support and Resistance Levels: In technical analysis, support and resistance levels are significant price levels where buying or selling interest tends to be strong. They are identified based on previous price levels where the price has shown a tendency to reverse or find support.
Support levels are represented by the green line and green shade, indicating areas where buying interest may emerge to prevent further price decline.
Resistance levels are represented by the red line and red shade, indicating areas where selling pressure may arise to prevent further price increases. Traders often consider these levels as potential buying or selling opportunities.
Breakouts: Breakouts occur when the price convincingly moves above a resistance level (red shade) or below a support level (green shade). A bullish breakout above resistance suggests the potential for further price increases, while a bearish breakout below support suggests the potential for further price declines. Traders pay attention to these breakout signals as they may indicate the start of a new trend or significant price movement.
Disclosure: I am not SEBI registered. The information provided here is for learning purposes only and should not be interpreted as financial advice. It is important to consult with a qualified financial advisor before making any investment decisions. Tweets neither advice nor endorsement.

USNAS100 (2H, Toward Bearish Station)Technical Analysis:
For the NASDAQ, as long as the price trades below 18,820, it is likely to drop to 18,735. To continue the bearish trend towards 18,550, the price must break below 18,735. Conversely, if the price stabilizes above 18,820, a bullish scenario will be activated, supporting a rise towards 19,100.
Pivot Line: 18,820
Resistance Levels: 18980, 19100, 19210
Support Levels: 18735, 18550, 18440
Today's range is expected to be between the support at 18,550 and the resistance at 19,100.

DAX 40 run out of gas?Today on Memorial Day, the US market will remain closed today. The ECB has focused on cutting interest rates trying to get ahead of its peers in the US and UK. European stocks have started slightly higher from Friday's close. Sentiment continued part of the day up 0.28% at around 18,745 points. Data from the Ifo institute on current conditions were slightly below expectations, with a score of 88.3 compared to the consensus of 89.8 and lower than the previous 88.9, so it is possible to see the currency turning bearish against the dollar. As for expectations, they have not been met either, although they were slightly more optimistic, closing at 90.4 compared to 89.7 in the previous publication. As we have said, this will also affect the Euro. And finally, the publication of the German business climate, has also been clearly bad, showing the same data as the previous publication of 89.3 against the expected 90.4. This indicates a possible pessimistic sentiment regarding the market situation.
If we focus on the chart, the DAX (Ticker AT: GER40) has been retracing its price touching highs in the middle of the month. A possible bullish pullback above the previous bullish breakout zone is currently being structured. The moment the 18,913.82 points (current high price) is surpassed, we will be looking at another possible "All-Time-High" (ATH) milestone. Currently the RSI indicator is not telling us much with a slightly overbought 61.09%, and the bell shape being dual. At the moment, there is a lot of pressure on two possible strong price zones: 16,721 points and 18,532 points. It is creating a possible third bell with low volume at the moment, in the area of 18,729 points. In order to continue at the highs, 405.75 points (2.19%) must be surpassed. It will be more likely to see a correction after testing the highs than a continuation of the success.
Ion Jauregui - AT analyst
*******************************************************************************************
The information provided does not constitute investment research. The material has not been prepared in accordance with the legal requirements designed to promote the independence of investment research and such should be considered a marketing communication.
All information has been prepared by ActivTrades ("AT"). The information does not contain a record of AT's prices, or an offer of or solicitation for a transaction in any financial instrument. No representation or warranty is given as to the accuracy or completeness of this information.
Any material provided does not have regard to the specific investment objective and financial situation of any person who may receive it. Past performance is not reliable indicator of future performance. AT provides an execution-only service. Consequently, any person acing on the information provided does so at their own risk.

Dxy is ready to dump!DXY is bearish.
●On HTF weekly FVG/BISI disrespected and now become an Invesion Fvg which should act as resistance.
●On Daily timeframe DXY got a rejection from The Daily +OB.
●In 4h Dcy created FVG which should bring Dxy down.
●Downside targets for DXY are 104.080 and 103.880 for now.
●Dxy should stay bearishso that other markets like stock, Crypto and Forex should see higher prices.

Currencies Chart & DXYCurrencies Chart & DXY ..........................................................................122131
Currencies Chart & DXYCurrencies Chart & DXY ..........................................................................122131


US30 SWING3 Days: RTM, it has been lagging however expecting a catch up this week.Look for entries above previous 4 Hour, Good risk to reward

DAX-STRENGTH LEADERDax: Weekly clean 1-2 RTM , Our Bullish confirmation pattern, expecting extended Run
Previous daily high broken and expecting volume at US open
Note:Bullish

US100 bias short Bearish indications:
Major resistance respected.
Double top formation.
Bearish divergence.
Bearish engulfer candle from resistance in 1 hr time frame.
Trade plan bias short @ 18804
SL:1885
TP1:18751
TP2:18706

