Nifty down side moveNifty is showing bearish singe of down fall the market is over bought so nifty can retest
Market indices


TASI Chart Brief Analysis
**Current Status:**
- **Index Value:** 11,659.940
- **Daily Change:** -171.280 (-1.45%)
**Trend:**
- Bearish trend with lower highs and lows.
- Recently broke below the rising channel.
**Support and Resistance:**
- **Support:** 11,473.273, 10,390.034
- **Resistance:** 11,850.000
**Indicators:**
- **Ichimoku Cloud:** Trading below the cloud, indicating bearish momentum.
- **MACD:** Bearish crossover with a negative histogram.
- **Oscillators:** Oversold conditions, potential short-term rebound.
**Trading Ideas:**
- **Short-Term:** Short positions with targets at support levels, stop loss above 11,850.000.
- **Long-Term:** Wait for a reversal above the Ichimoku cloud for long positions.
**Note:** Combine technical analysis with fundamentals and market news.

US30 Trading Outlook: Bullish Moves and Key Targets!Greetings, Traders,
Brief Description🖊️:
At the moment, I am seeing a potential draw towards minor bullish objectives, specifically the H4 buy stops, and a movement towards the institutional resistance point (reclaimed order block) to fully fill the daily timeframe FVG. This point is also aligned with a liquidity void, indicating a price inefficiency that may be filled in the future, adding more confluence to the possibility of reaching the reclaimed order block (institutional resistance zone).
Things I Have Seen👀:
Liquidity Engineering🔄: Yesterday, smart money engineered liquidity using a support zone, which was established to attract retail investments. These investments were manipulated so that smart money could buy against the liquidity presented as stop losses below the support zone, using those stop losses as willing sellers.
Current Price Action💹: The price may be supported by the order block. Upon confirmation on the lower timeframes, I will look to buy at that order block and continue doing so as a day trader until both objectives are reached.
Kind Regards,
The_Architect

HK50 Future Market Outlook: A Good Entry Point with a 2:1 Risk-RThe Hang Seng Index (HK50) is currently showing signs of a potential upward trend, making it an attractive option for investors. Here are the key reasons why now could be a good time to enter the market, especially with a risk-reward ratio of 2:1.
Technical Support and Resistance Levels
Strong Support at the Bottom: The HK50 has recently demonstrated strong support at its current bottom levels. This indicates that the market has found a floor and is less likely to fall further in the near term.
Previous High Breakout: The index has previously broken above significant resistance levels, indicating strong buying pressure and the potential for continued upward momentum. This historical breakout suggests that the market has the strength to overcome resistance and move higher.
Risk-Reward Ratio
2:1 Risk-Reward Ratio: Entering the market at this stage with a 2:1 risk-reward ratio is a prudent strategy. This means that for every unit of risk, there is a potential to gain two units of reward. Such a ratio is favorable for investors, as it limits potential losses while maximizing potential gains.
Controlled Risk: By setting a stop-loss order at the recent support level, investors can manage their risk effectively. If the market were to decline, the loss would be limited to the predetermined stop-loss point. On the other hand, if the market continues to rise, the potential gains would be twice the risk, offering an attractive return on investment.
Market Sentiment and Indicators

Sell set up for spx500Looking to see if we will get a retest back to the previous lower high structure. If the markets close back outside of the zone, then this will be my sell set up that I will take


Dow Is Dropping - Is a Reversal imminent?Although the Dow Jones initially squandered its chance of a recovery today, prices are likely to rise soon. The performance of the index does not harmonize with the overall market sentiment. The RSI and MACD are extremely oversold. Market internals such as the VOLD also point to cautious selling interest. For these reasons, we once again see a long opportunity that offers an extraordinarily good RRR of around 6:1.

US100US100 is currently in Bullish Trend and respecting support with divergence . Expecting further move up word.

SPX Bear Diamond InboundWe have a bear diamond and many are ignoring the longer term trend line that hits the peak of the January 2000 top on the 1-3 month timeframes, Our October 1st 2021 Top and our current top around 5350-5400, this resistance has created an intraday bearish diamond pattern that's about to play out by tomorrow to sub 5,200

US 30 short - swing trade (update) As previously discussed we expect further pa to the downside and the market to hunt for the HTF sellside liquidity.
Market just traded through the sellside liquidity. Hope some of you guys managed to get onboard or at least LEARNED something form the idea.
Stay safe and never risk more than 1-5% of your capital per trade. The following analysis is merely a price action based analysis and does not constitute financial advice in any form.

Double Top, Next Target is Trendline Bottom.Down Trend start, because Banknifty did not closing above previous top or resistance level and it formed Double Top. So we expect market coming down, next Target is Trendline Bottom.
And also Nifty 50 did not Breakout the Channel Pattern, Trendline also Breakout, SGX or GIFT also Breakout Trendline.
I want to help people to Make Profit all over the World.

US30 on Support Level... Bullish!!!!!!1. US30 on support level.
2. Chances are high for long from this level.
3. once its broken below short we can expect a short un till its long.


NIFTY: Trading Plan for May 29, 2024Based on recent price movements, NIFTY has experienced a decline as anticipated, yet it hasn't fully completed its corrective structure. Here’s the detailed trading plan for Wednesday, May 29, 2024:
Gap Up Opening:
Opening Above 22920: If NIFTY opens with a gap above 22920 and sustains above 22950 for the first trading hour, it may trade towards the 23011-23027 range, where it could face resistance.
Sustaining Above 23030: Should the price sustain above 23030, expect support around 23011-23000, with potential upward movement towards 23140.
Failure to Sustain: If NIFTY fails to sustain the gap-up opening levels, it could continue its corrective pattern, seeking support between 22855-22830.
Flat Opening:
Initial Support Range: A flat opening might see NIFTY finding initial support in the 22855-22830 range.
Breaking Below 22810: If NIFTY trades below 22810, it could drop to 22762-22738, where buyers might attempt a reversal.
Gap Down Opening:
Opening Below 22800: If NIFTY opens below 22800, it might find support between 22762-22738. Traders should consider buying with a stop loss (SL) at 22700.
Trading Below 22700: Should the price break below 22700, further declines towards 22617-22600 are possible.
Conclusion: Traders should closely monitor the opening levels and the market's ability to sustain those levels to determine the appropriate strategy.
Disclaimer: Trading involves risk, and it's essential to perform due diligence and consider individual risk tolerance before making any trades.

BANKNIFTY: Trading Plan for May 29, 2024
Similar to NIFTY, BANKNIFTY has shown a corrective move but hasn't completed its structure. Here’s the detailed trading plan for Wednesday, May 29, 2024:
Gap Up Opening:
Opening Above 49200: If BANKNIFTY opens with a gap above 49200 and sustains above 49300 for the first trading hour, it may move towards the 49363-49404 range, where it could encounter initial resistance.
Breaking Above 49410: Sustaining above 49410 could lead to a further rise towards 49550.
Failure to Sustain: If BANKNIFTY fails to sustain above 49300 and drops below 49100, it may find support at 48945-48880. Trading below 48850 could push it down to 48716-48653, where buying opportunities might emerge with a stop loss at 48600.
Flat Opening:
Initial Support Range: A flat opening might see BANKNIFTY dropping to the 48945-48880 range for initial support.
Trading Below 48830: If BANKNIFTY trades below 48830, look for buying opportunities between 48716-48653 with a stop loss at 48600.
Gap Down Opening:
Opening Below 48900: If BANKNIFTY opens below 48900, it might initially recover if it regains the 49000 level and trades above 49050. This scenario offers a buying opportunity targeting 49200-49363.
Failure to Recover: If BANKNIFTY faces resistance at 48945-48900 and fails to recover, expect further declines towards 48716-48653, presenting another buying opportunity.
Conclusion: Pay close attention to how BANKNIFTY reacts to the opening levels to determine the appropriate strategy.
Disclaimer: Trading involves significant risk, and traders should conduct thorough analysis and consider their risk tolerance before executing trades.

Nifty 50 Reached CHANNEL Top. Wait for Breakout, which directionNifty 50 reached again "CHANNEL" Top. Wait for Breakout to confirm which direction. If Breakout above the Channel Top, it will become Very Bullish. Otherwise, it may come down.
I want to help people Make Profit all over the World. Additionally, I am eager to Receive Money form Worldwide because of my Potential.
Refer this image :

US 30 short - swing trade Taken a short swing from 38900 towards the 1H OB.
Entry 38900
TP 38864
SL 38929.5
Expecting some further downside from here taking out the sellside liquidity.
IF we fail to break below the current lows expect us to retrace back towards this morning's buyside.
No need to run after the market...LET IT SHOW YOU ITS HAND AND FOLLOW IT.
Stay safe and never risk more than 1-5% of your capital per trade. The following analysis is merely a price action based analysis and does not constitute financial advice in any form.


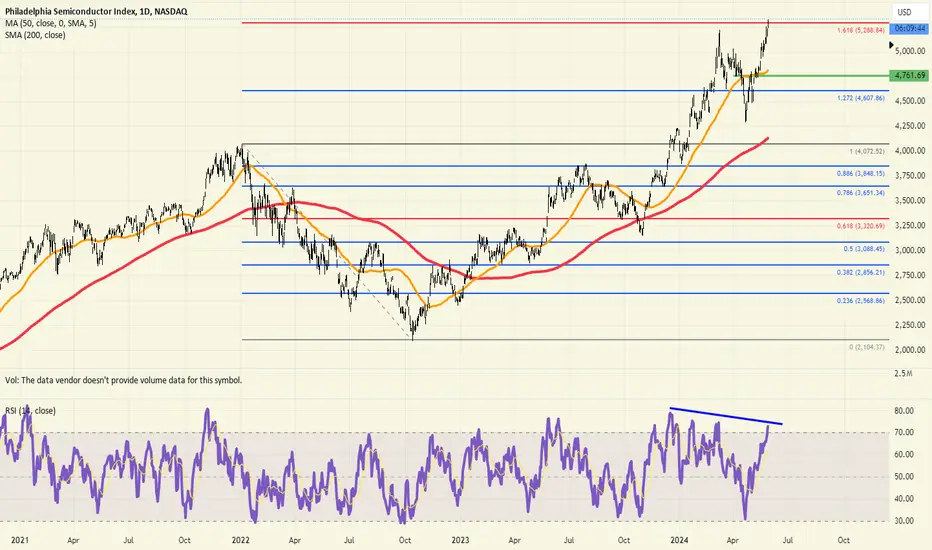
Semi's hitting key Fibonacci extension todayIntraday Update: SOX is at the 161% Fibonacci extension. Many traders are looking at new highs on the index, we are seeing key Fib level and divergent RSI.
GER30 SETUP GER30 expected move today or tomorrow but we expect it to bounce on our OB the we executed uor trades

Trade plan for tomorrow BNAKNIFTY important/Intraday levels.Trade plan for tomorrow. BNAKNIFTY important/Intraday levels.
No Price Action
No Support and Resistance
No Indicators
No Moving Averages
Not Gann levels These levels are purely based on mathematics.
If it is useful please give your comment.
