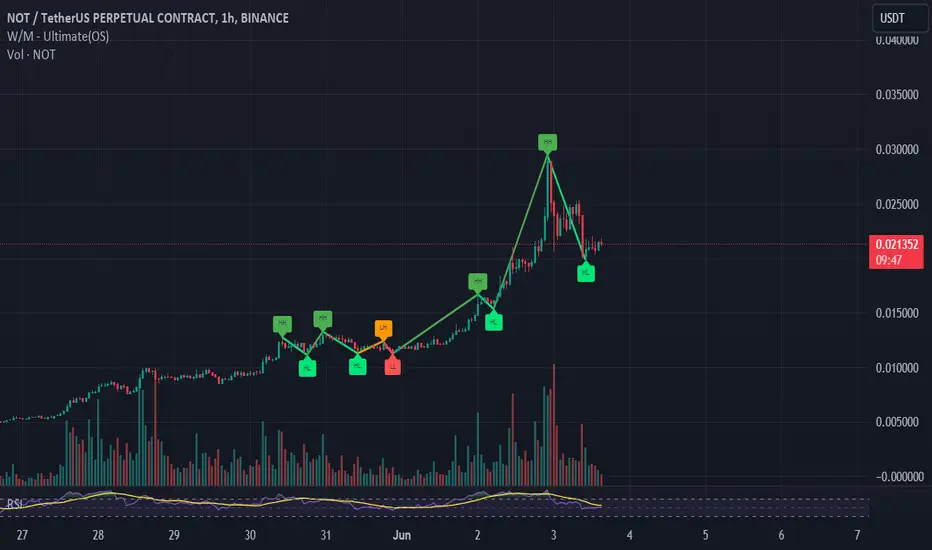
NOTNOT is making Higher HIGH and higher low in 1 hour chart.
It already broken the channel, it can break it all time high.
Crypto market
Lingrid | SHIBUSDT long from the SUPPORT zoneThe price perfectly fulfilled my previous idea. The market went up and hit the target level. BINANCE:SHIBUSDT has been trading within a range zone, before breaking out to the upside and subsequently pulling back. This price action has formed a triangle pattern, with the price now testing the boundary of the shape. As the price approaches the support levels, it's consolidating around the swap zone. I believe the market is likely to shift upward if it successfully rejects the swap level and breaks above it. Meanwhile, I expect the price to continue its upward momentum from the ascending trendline, which has been guiding the movement. My target is resistance at 0.00002800
Traders, if you liked this idea or if you have your own opinion about it, write in the comments. I will be glad 👩💻

MANTA/USDT Potential 90%++Accumulate under $1.88 - $1.44
Targets Points
TP 1 : $2.2
TP 2 : $2.58
TP 3 : $2.98
TP 4 : $3.25
TP 5 : $3.5
TP 6 : $3.7
SL : $1.35

GALA ANALYSIS🚀#GALA Analysis :
🔮As we can see in the chart of #GALA that there is a formation symmetrical triangle pattern. Also there is a perfect breakout. But there is an instant resistance zone and if #GALA sustain this breakout and also breakout the major resistance zone then we would see a bullish move📈📈
🔰Current Price: $0.04740
🎯 Target Price: $0.08253
⚡️What to do ?
👀Keep an eye on #GALA price action. We can trade according to the chart and make some profits⚡️⚡️
#GALA #Cryptocurrency #TechnicalAnalysis #DYOR

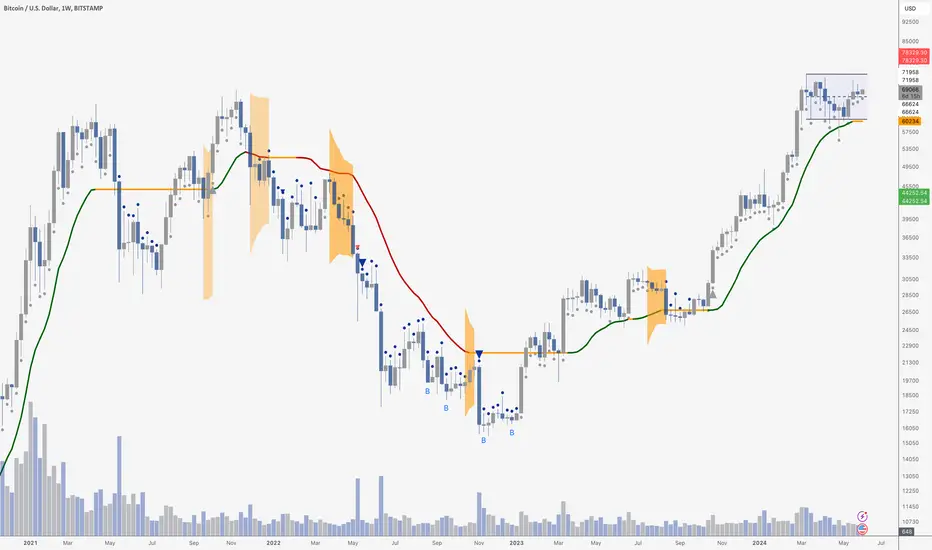
BTC LOOKS STRONGIt is essential to occasionally zoom out.
Taking a look at the weekly chart gives us an astounding picture of Bitcoin’s move. This consolidation looks like almost nothing after this run up from $15,000 - just the expected chop after the halving.
As you can see, we are trading in the top half of the blue range, which means we should eventually visit the range highs. A break above send us back into price discovery,
Be patient - everything still look exceptionally strong.
PEWUSDT Trading opportunityPEWUSDT is exhibiting a rounding bottom formation, with the price having already broken above the setup neckline and moving towards the final target. The price has completed potential waves 1-4 and is now in the final leg of the wave to complete the current cycle.
Our trading plans involves buying within the designated buyback zone and focusing on the immediate target indicated on the chart.
Should this level be breached, we may see the price extend towards the final setup target.


BTC: Bull Pennant forming! Previously, the price formed an inverse Head & Shoulders pattern and broke the neckline to the upside. Now, it is consolidating in a bull pennant pattern, indicating a high probability of further upward movement. If the price breaks the resistance zone, reaching 80k is likely.
Currently, attention is on the DXY and S&P500. If the DXY continues to decline, a new ATH for both the S&P500 and BTC is expected. Therefore, monitoring the DXY is crucial to anticipate BTC's next direction. For now, the DXY has been declining, so a bullish move for BTC could be imminent!


TONUSDT BULLISH Looking forward to accumulate the bottom on TONUSDT. After the growth of NOT, TONUSDT is poised for heavy growth & we shall see a big impulse in TONUSDT soon, Remember to DYOR!!

RSRUSDT UPDATE
Dear Respected Traders, we hope this communication finds you well.
we are convening a discussion focused on #RSRUSDT
THE Breakout Has Already Done Now Its Retesting ✅
So,I Expect a Bullish Move of 50% in Coming Days 🚀
#Bitcoin #Crypto #Ethereum #Cryptocurrency #CryptoTrading #BTCUSDT #ETHUSDT #ALTCONS #USDT CRYPTOCAP:BTC CRYPTOCAP:ETH CRYPTOCAP:USDT

THE NEW PEAKDISCRIPTION
From 8-Nov-2021 to 4-Mar-2024 , bitcoin corrected the market structure in the shape of a semicircle after two months of trying to create a flag pattern , which indicated a rise
technically
the price is under upward pressure as long as trading continues at 65,521 to reach 71,203 and 73,736 by stabilizing at 71,203 will have a new peak other wise stabilizing below 65,521 will target the areas of 61,598 and 57,475 .
pivot line: 65,521
resistance line: 71,203 _ 73,736
support line: 61,598 _ 57,475

TONCOiN $1.60 | Elon Loves Huge Communities @ $40bn CapTwitter at early seed stage
driven by community to rule all blockchains present and future
could be the Google in the next 50 years

$GST one last exit pump?LSE:GST has been in a downtrend since the beginning of March, I think we could see one last exit pump up to the two resistances higher before continuing down.
If you can time this properly, looks to be great gains in a short period of time.

DYDXUSDT 1DFalling wedge pattern on the #DYDX daily chart. It is trying to break out the pattern resistance and MA50. Targets are:
$2.222
$2.606
$2.917
$3.228
$3.670
$4.234
Supports:
$1.869
$1.600

PEPEUSDT BUY NOW!!!!!!!!!!!!!!!!!!!!!!!!!!!!PEPE fulfilled my last analysis predictions now price is moving towards the buyside to sweep liquidity above 0.00001724 am going long from this point till that target is completed.........
JOIN AND ENJOY
tell us what you think...............?

Follow the Pattern part2About the same volatility contractions in the same areas. Maybe candles 13 and 14 are needed but regardless, expect different volumes: up or down but will eventually make their way up.
I've included volume range measurements. I hope its different volume price will reach the SWB:69K zone and then dip to follow its pattern.

GALA: strat bullish trend ?📊Analysis by AhmadArz:
🔍Entry: 0.04548
🛑Stop Loss: 0.04265
🎯Take Profit: 0.04847 - 0.05102 - 0.05434 - 0.05813
🔗"Uncover new opportunities in the world of cryptocurrencies with AhmadArz.
💡Join us on TradingView and expand your investment knowledge with our five years of experience in financial markets."
🚀Please boost and💬 comment to share your thoughts with us!

2 DOUBLE TOPS at a 1% risk reward ratio Sorry traders; I accidentally left my encryption on while submitting this idea about 4 hours ago while BTC was dropping therefore no one could see it. All I did was add it to a plain chart. Below idea comment was what was said while submitting idea.
Why the drop, well let’s scalp. Most recent double top is set to a 1% drop, can go to 2%. Last double top is at a 1% drop and met its course.
Why 69k, because recent idea called “ FOLLOW THE PATTERN WITH BANK ENTRYS” reads to reach 69K then tiny dip. May be more or less because halving has different volume.
I’m also showing reversal pending.
Blue horizontal lines has a KROLL ATR measurement reader.

Dymension: oversold and turning upGood Sunday to everyone, nice setup forming today in BINANCE:DYMUSDT , this coin came as an airdrop to ATOM and TIA stakers, and will itself generate a lot more airdrops to holders who stake coins and gradually reinvest staking proceeds. (a common meta in the Cosmos ecosystem, which brought something like 28k% APY to stakers during 2021)
Best of luck!
Cheers,
Ivan Labrie.

KAVAUSDT Triangle Pattern!KAVAUSDT Technical analysis update
KAVA has formed a triangle pattern on the 4-hour chart. It is currently bouncing from the triangle support, indicating that we can expect a significant move from the current support level.
Regards
Hexa

SANDUSDT 1DKeep an eye on #SAND. It is trying to break out the resistance. In case of a solid breakout, the targets are:
$0.5384
$0.5935
$0.6485
$0.7268
$0.8266
