Crypto market

LTC is duplicating BTC's pre surge DNA based on MONTHLY metrics.FOCUS ON LTC.
A theoretical and technical analysis of these two major coins price movements.
LTC's recent monthly price metrics is reminiscent of BTC's September 2023 movements before it shot up from 20k to 40k. As we speak, it is following the DNA of that certain movement. We are now at the critical heat point for that X2 surge.
BTC post surge price touched 38.2 fib trend levels with precision at 40k from its 20k++ base range. A similar scenario for LTC will likely play out. A 38.2 fib trend level would mean a 150 price valuation after a break in structure. We are now at that crosspoint.
Spotted at 70.0
Conclusion: If you're late with the BTC bull party, LTC will now be your ultimate friend.
TAYOR.
Safeguard funds always

ETH, recent pump barely scratching the surface MASSIVE MOVE NEXT
ETH recent pump was an indication of things to come -- good things.
The coin went from 1700 to 1900 within 72 hours -- indicating that a longer shifting trend is about to materialize. Based on recent news, low supply of ETH is being detected on most exchanges depicting a bullish scenario for the coin.
On weekly data, new higher lows was created both on Histogram and pricing -- conveying the recent ascend with the current price range to be the new base for the incoming significant price growth.
Weekly data price movement volatility has been on the conservative side hinting that for every higher low it established -- it is creating a solid support range.
On Tri monthly data -- it is hinting of the same bullish continuation scenario. Surging price valuation on longer time spectrum. A bubble up volume has finally appeared after 5 months of waiting, last one was on January 2023.
Expect significant price valuation for ETH in the next coming weeks.
The weekly chart is too clean, direction is certain -- no further explanation needed.
Spotted at 1850.
TAYOR
Safeguard capital always

BTC ready for the pump??As I marked out you can see a descending channel followed by a bullish pendent that's breaking out. I've also marked out key levels that price bounces from. As of today price has reacted of the range of 67500 (Each level being marked 2500 apart). I believe we can be seeing prices reaching 82500 pretty soon! Hope everyone is having a successful trading day so far. BTC to the Moon. good luck everyone

TROYUSD 1WTROY ~ Updated
#TROY Do not miss this. This is the bottom part. The bulls will come soon and pump from here.

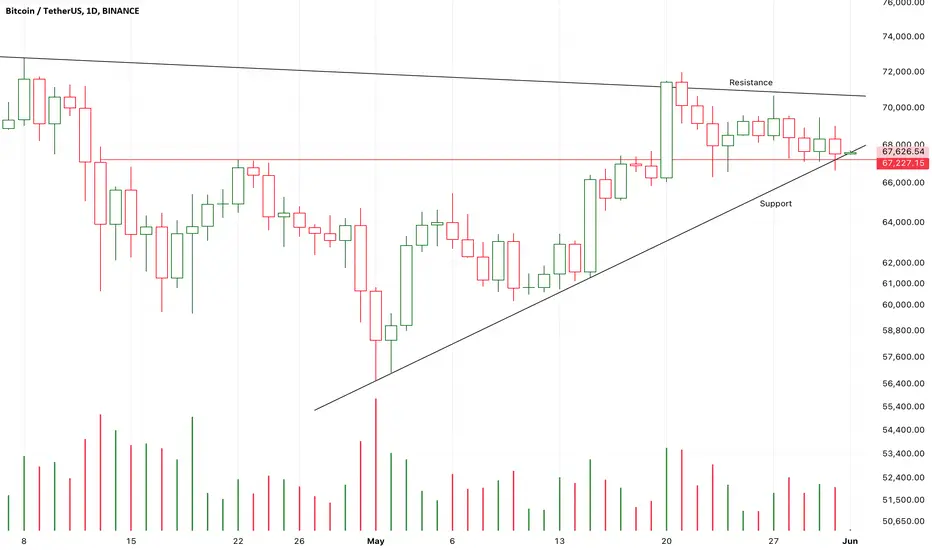
Chart Pattern Analysis Of Bitcoin
K3 break up and close upon K2 under low supply pressure,
It seems that the following candles will price up to test the resistance.
I don’t think this is the start of another bull run,
It is just a Wave(B) of a larger scale consolidation process.
But during this process,
Some other crypto tokens will do better.

Chart Pattern Analysis Of Bitcoin
Trend Analysi:
From the chart, we can see that after experiencing a downtrend, Bitcoin's price is currently in a relatively stable consolidation range.
The recent price action shows Bitcoin fluctuating between $67,000 and $70,000. Although there have been several attempts to break through $70,000, they have all failed, and the price is currently around $67,650.
Support and Resistance Levels:
Support Level: The current support level is around $67,000, which is a strong support area. If the price breaks below this support level, it may further decline to around $60,000.
Resistance Level: The main resistance level is around $70,000. If the price can effectively break through this resistance, it may usher in a new round of upward movement.
Candlestick Patterns:
The recent candlestick patterns show a few bullish candles, but overall, the price movement is not significant, indicating market hesitation.
Observing the trading volume, we can see an increase in volume in recent days, indicating increased market activity, which may suggest a significant price movement ahead.
Conclusion
Combining the above analysis, Bitcoin is currently at a key support level, and the increase in trading volume indicates higher market activity. If it can hold above $67,000 and show signs of breaking upwards, it may be considered a good point to start building a long position. However, close attention should be paid to market movements and volume changes to prevent risks if the price breaks below the support level.
Operational Suggestions:
Aggressive Investors: Can start building long positions around $67,000, with a stop loss set below $66,000.
Conservative Investors: Wait for the price to break and hold above $70,000 before entering a long position to confirm the upward trend.
Please proceed with caution based on your personal risk tolerance and market conditions. It is advisable to combine this with other technical indicators and market information for comprehensive analysis.
$OM is ready for the bullrun #MANTRA team is pushing forward and I am still holding from late 2023!
Only a matter of time before NASDAQ:OM goes higher. We still got a long way to go until even #ATH so I’m holding a nice bag.
NASDAQ:OM seems well-prepared for the next #RWA token run.

A few points that I often repeat to myself to sober myself upEveryone has noticed that after a profitable position, emotions of joy pass quickly than in a situation with a loss. Mostly we all know the instruments, we all use same tools, we can watch,read million sources about trading. So why less than 3% profitable on a distance?
⌛️Psychology
A few points that I often repeat to myself to sober myself up
- Your expectations, your problems! Just because it seemed to you that the price should have gone in your direction, does not mean that the market is against you! I understand that there will ALWAYS be losses! Therefore, I came to terms with this fact and simply treat trading as a job! If you open any other offline business, you will have costs and expenses, losses! It's the same story with trade!
- I conducted a survey and see that the majority are trading from liquidation! I try to balance with 1% trades! Of course 0.5 is better. Plus you need to determine the amount of loss you can afford per day! It is best to stop at 2 unprofitable trades per day! Then you just want to win back again and again!
- Pauses! You definitely need to take breaks! The number of trades absolutely does not determine success! Although I used to think that if I don’t trade today it means I’m not working! Not really, quality is more important than quantity.
- Probably the most important thing is that victories or defeats in the market cannot and should not in any way affect my attitude towards life in general, my family, my health! It's just a job in which there is no limit to learning!
---
• Look at my ideas about interesting altcoins in the related section down below ↓
• For more ideas please hit "Like" and "Follow"!

Pepe Is looking ready for a crashHey! Looks like Pepe is ready for another leg down.
I am shorting right now.
Stay profitable.
- Dalin

CRVUSDT trading opportunity with Key Zones to Watch!We're currently witnessing intriguing dynamics in the CRVUSDT chart after the recent breakdown from a rising wedge pattern, bearish sentiment seems to be in play, but there are specific zones we should take note of.
CRVUSDT exhibited a classic breakdown from the rising wedge pattern. The base of the rising wedge is now our immediate focus. As we approach this zone, it could serve as a strong support level. For those with a bullish bias, this could be an area of interest for potential long entries.
However, a word of caution, if the price decisively breaks below this wedge support, it will flip roles and become a strong resistance.
In such a case, shorting the pullbacks towards this new-found resistance could offer lucrative opportunities, with targets pointing towards the Potential Bear Target as shown on the chart.
Moreover, on the flip side, higher on the chart lies a significant lateral resistance zone. This region has proven to be a thorn for the bulls previously. If at any time, the price manages to pierce through this zone with conviction, we might be in for a bullish reversal. Keep a hawk's eye on this!
With both bearish and bullish scenarios on the horizon, it's vital to be nimble and trade based on confirmed signals.
As with all trades, make sure to employ stringent risk management and await confirmations before making entry decisions.
Happy trading.


#DYM/USDT#DYM
The price is moving within a bearish trend channel that was broken to the upside on a 12-hour frame
We have a support area at 2.50 and we bounced from it at the lower border of the channel
We have a tendency to stabilize above the Moving Average 100
We have an upward trend on the RSI indicator that supports the rise and gives greater momentum
Entry price 2.72
First target 3.74
The second goal is 4.30
Third goal 4.92


BTCUSD Short: Completion of Wave 2Update to my idea previous where I mentioned that I expect a wave B down and then a wave C up. Now that I expect this wave 2 to have completed, it is time to short BTCUSD.

#MANTRA NASDAQ:OM has undergone a correction and is now in a nice accumulation zone.
Things will soon turn bullish again for #MANTRA. The real Bull Run for NASDAQ:OM hasn't even started yet.
The NASDAQ:OM Dominance chart shows this.
We aren't in the mania phase yet when everything goes parabolic.
Done on 23-05-2024

#MANTRA The last few days have been pretty eventful for #MANTRA and I am assuming that the coming days will surprise us more as the BlackRock partnership, Grayscale and Bybit Spot Listing and many more updates are on its way.
So I'm really looking forward to the coming months as we'll then be reaping the rewards of all the team's hard work.
NASDAQ:OM #RWA

DOGEUSDT.1DHere’s my detailed technical analysis of the DOGE/USDT daily chart:
Price Action and Structure:
The DOGE/USDT chart is demonstrating a pattern of ascending lows, indicative of a bullish sentiment in the formation of an ascending trendline. The chart’s structure with ascending trendline support suggests that buyers are incrementally willing to buy at higher prices, a positive signal in market sentiment.
Technical Indicators:
1. RSI (Relative Strength Index): The RSI stands at 54.37, which suggests moderate bullish momentum as it is above the neutral 50 mark but not yet into overbought territory. This positioning allows for potential upward movement without immediate pressure from an overbought correction.
2. MACD (Moving Average Convergence Divergence): The MACD is slightly above the signal line but very close to the zero line, indicating a lack of strong momentum. This scenario typically calls for cautious observation as it could imply potential for either direction, but the current slight bullish crossover can be seen as a tentative bullish signal.
Support and Resistance:
• Support (S1 and S2): Support at $0.12157 (S2) is critical. If the price maintains above this level, it may consolidate and attempt an upward movement. However, breaking below could lead to a test of lower support levels.
• Resistance (R1 and R2): The immediate resistance at $0.17569 (R1) needs to be watched. If the price can break and hold above, it would target the next resistance at $0.21158 (R2), indicating a significant bullish trend strength.
Projection and Strategy:
The projection on the chart anticipates a bullish move towards R1. If DOGE/USDT can maintain the ascending trendline, it could potentially approach and surpass R1, aiming for R2. A strategic approach would involve buying near support levels with a tight stop loss below the trendline to manage risk, while selling near resistance levels or holding if a breakout above R1 is observed with significant volume and momentum.
Conclusion:
DOGE/USDT is showing promising signs of a bullish continuation if it can uphold the ascending trendline support. Monitoring the price action near the support and resistance levels, along with the accompanying volume and indicator signals, will be crucial in confirming the trend’s strength and sustainability. As always, keeping an eye on overall market sentiment and news specific to Dogecoin will also be important in shaping the trade approach.

ETH in 4h time frameI imagine such a movement for Ethereum in the coming days. A side trend between prices of 3500 and 4900 dollars..

78980 next tp BTC now prepared for new ATH which will be around 78980 plus minus , this may be the last rally of 1st bullish rally , still time to decide , if this is last rally which confirmed triggered recession pullback of all world financial intrument to ground , floor inclu nasdaq gold

LONG MANTAManta is a project that I've been paying attention to since its launchpad that took place during the last bull run. A good launch and proper pullback may be a good buying opportunity.

BTC forecasting As we see here in our logarithmic chart, Bitcoin has been adhering to this trend line curve since its inception. Each year, the upward angle decreases, aligning with an increase in the duration of the ascent and a decrease in the percentage of the ascent. The correction occurs at an almost constant angle until it touches the bottom line. If Bitcoin continues on this path, I predict it will reach $102,000 by September of this year, then it will begin a correction with an angle similar to the past, reaching prices between $44,000 and $49,000, which are support zones.

Ethereum Long Term TrendI expect this kind of movement from Ethereum in the next period when altcoins rise. My target is 12k in Ethereum, which has a 4-fold upside potential. In a possible pullback, the support level will be $2250.
