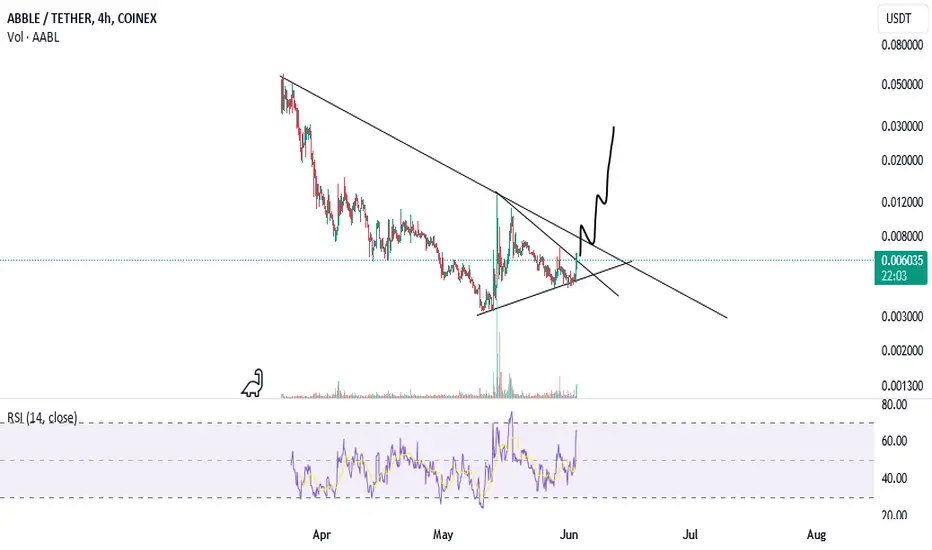
OP portunity of a lifetime... the BIG SHIFT coming.OP accumulation is ON at the moment -- and price is ascending gradually, creating higher lows on daily chart.
Big movement is expected within the next few days.
SEEDING at 2.28.
TAYOR.
Crypto market

After bonk , pepe, turbo, it's time for mongCharts talk to you.
Take a look at the mong chart.
Volumes, breaks, liquidity limits.
I strongly believe in it.
It will have a good flight.
Accumulations have increased and
Attractive transactions of mong whales

Bitcoin near a possibly resistance levelBitcoin if following the monthly pattern since the beginning which involves two angles , above a tl which is acting as support and below a tl so possibly a resistance, it could be a consolidation zone or could move it to the next level if breached

WUSDT, A massive buying opportunity happening sonWelcome, Trader. Welcome to our cryptocurrency community! 🚀We are delighted to welcome you, whether you are an experienced trader or a newcomer to cryptocurrency.
We are going to discussing #WUSDT 💹
#WUSDT 🔥🚀
---------------
Update:
#W formed a bullish triangle pattern over a 6Hr time frame 👉✅.
Breakout is done successfully ✅🎯.
We are expecting a minimum of 50% 💰 very soon
Crypto Analyst Hub
#crypto #cryptocurrency #bitcoin #ethereum #blockchain #btc #cryptotrading #cryptonews #eth #cryptocurrencies #nft #bitcoinnews #bitcoins #trading #bitcoinmining #forex #binance #cryptoart #nfts#trading #forex #trader #investing #stocks #forextrader #stockmarket #daytrader #forextrading #invest #bitcoin #daytrading #cryptocurrency #crypto #investor #investment #forexsignals #nse #chartpattern #cedarforex #candlepatterns #learntrading #bseinstitute #shorttermtrade #bankniftytrading #stockmarketph #calloptions #mqlsignal #futuretrader #tradingmemes #chartpatterns #tradingview #tradinglife #tradinglifestyle #tradingstrategy #tradingtips #tradingplan #tradingsignals #tradingaccounts #tradingsignal #tradingforex #tradingsync #tradingroom #litecoin #ethereum #bitcoincash #cryptocurrencies #ripple #btc #bitcoinnews #bitcoinmining #blockchain #eth #bitcoin #bitcoins #coinbase #cryptocurrency #crypto #bitcointrading #dogecoin
BTC
ETH
USDT
PEPE
DOGE
ALT

Jupusdt showing great opportunity againJupusdt is once again displaying signs of forming a potential rounding bottom pattern after the correction phase following the achievement of our target for the primary rounding bottom, which yielded significant rewards in our previous analysis.
Our plans entails buying from the buy-back zone and focusing on the provided targets. These targets will come into play once the immediate neckline, acting as strong resistance, is breached. We advocate for implementing a tight stop loss to manage risk effectively.
We value your insights and opinions on Jupusdt and welcome further discussion on this coin.

LOBO: $0.00 17 | The Wolf in BTC's Runes Protocol a fungible token
only housed contained in the most secured and refined network
enhanced from the STACKS protocol (BTCS layer 2 think MATiC of ETH)
RUNES is a refined version of ORDiNALS in creating projects tokens etc..
Ordinals caused downtime in the BTC network calling attention of issuers to stop creating memes coins ... RUNES solves that problem...
in a NUTSHESLL.. this LOBO meme coin is like DOGE on ETH or LandWOLF on AVAX
for more in depth appreciation
just back read threads on STACKS ORDINALS BITMAP ... its quite a trip to the next EVOLUTION of Bitcoin which is MULTIVERSE
minting and dealing in MAGIC EDEN to setup wallet is a pain in the neck ..
just buy in DEX and submit your wallet address for AIRDROPS ALLOCATION in the future

$WIF - Zones of interest for LONG entriesCRYPTOCAP:WIF has recently printed a new lower high, broke out from a pennant, did a Change of Character and now seems to be looking for drawing a new lower low to finally establish a continue of a bull trend.
Price going below 2.40 could invalidate the bull trend, but there are several zones of interest to buy CRYPTOCAP:WIF for a long entry, these being:
3.2 usd
3.1 usd
2.9 usd
2.7 usd
2.5 usd

Good analysis and advice may make you moneyBTCUSD is going down
first target around area
65300 : 65700
second target around area
62100 : 62600

DO not miss this GEM, NWC preparing for Huge RallyGreetings,
While exploring the web for potential GEM coins, NWC crossed my mind. We're all aware of its significance and reliability, having generated considerable profits in previous years. Now, the time has come to once again benefit from the potential of this remarkable GEM. NWCUSDT operates within the educational, AI, and GameFi sectors, boasting a market presence of approximately four years and listings on over ten exchanges. It's remarkable to witness the team's continued activity even amidst bearish market conditions.
Moreover, what truly captured my attention is the substantial portion of the team's token holdings locked until 2028, constituting a significant portion of the circulating supply. The fact that NWCUSDT has established partnerships with industry giants like Binance and Bybit further underscores the significance of this GEM.
NWC displays complex structures, with more than four patterns identified on a single coin. We will discuss each pattern and highlight their opportunities for investors and traders.
1. Rounding bottom reversal pattern
NWCUSDT demonstrates a rounding bottom reversal pattern, suggesting a transition from a downtrend to an uptrend. This pattern often signals a shift in market sentiment towards bullishness.
2.Wave Count shown strong uptrend in the making
Through wave counting, a strong uptrend in the making is identified. This analysis technique helps assess the momentum and direction of the market trend, providing valuable guidance for traders
3. Ascending Channel Formation
An ascending channel formation is observed, indicating a bullish trend characterized by higher highs and higher lows. This pattern can offer potential entry and exit points for traders.
4. Potential ISHS formation
The presence of a potential ISHS formation suggests a reversal from a downtrend to an uptrend. Traders may anticipate price movements based on the completion of this pattern, potentially indicating a bullish outlook for NWCUSDT.
In each of the aforementioned patterns, the endpoint is compelling, presenting significant bullish opportunities. The indicated Accumulation zone holds crucial importance for substantial and robust buying opportunities. For ISHS structures, it's advisable to set stop losses below the Head area. Profit targets range from immediate targets, such as the ISHS target area, to the primary setup target around the $117 area. It's essential to note that this perspective is long-term and not expected to materialize overnight.
We would greatly appreciate your contributions in the form of likes and comments.
Thank you.

Long signal for APE/USDTThis technical analysis is based on the daily chart of BINANCE:APEUSDT on the Binance exchange. This analysis draws two price channels and evaluates support and resistance levels.
Price Channel Analysis:
The previous bearish channel is broken out, and a bullish channel is formed.
The suggested entry point is around 1.289 USDT.
Entry and Exit Points:
Entry: 1.289 USDT
Take Profit: 1.727 USDT (34.00%)
Stop Loss: 1.114 USDT (13.55%)
R/R Ratio: 2.51
Conclusion:
This analysis suggests that by adhering to the specified take profit and stop loss levels, a successful trade can be achieved. The Reward/Risk Ratio for this trade is approximately 2.51, indicating a highly favorable risk-to-reward scenario. To manage risk effectively, it is recommended to strictly follow the stop loss level.

#ICX/USDT#ICX
The price is moving within a falling channel on a 1-day frame, which is a retracement pattern
We have a support area at 0.2000 and we bounced from it at the lower border of the channel
We have a tendency to stabilize above the Moving Average 100
We have an upward trend on the RSI indicator that supports the rise and gives greater momentum
Entry price is 0.2000
The first target is 0.2600
The second target is 0.2967
The third goal is 0.3360

Vetusdt Trading opportunityBased on the recent bullish trend in VET, the price has undergone a correction and is currently exhibiting a structure resembling a typical round bottom formation.
If this pattern materializes as expected, it could lead to the formation of a small cup before a potential breakout.
The chart indicates the presence of a buyback zone and an important external demand zone, both of which are acting as strong support levels. Additionally, there is an internal supply zone and established resistance targets.
Your insights and engagement through comments and likes are appreciated. Thank you.

Filecoin Key Levels for the 2024-2025 RiseUse this chart for reference to key levels guiding us out of this macro bottom 2024 -2025. The BTC halving is complete and now the decent to a support level below is likely before the rise.
The chart explains itself once you know the terms -
We have Breaker blocks below with good volume for support.
Areas of confluence where multiple key levels line up together are marked such as a range point of control (rPOC) and a fibonacci 618 level will say 618 + rPOC - you get the idea.
The vwap snap points are key levels as well. (white line on the chart)
Volume profile pulled over the massive range varies a bit over time but this is a good snapshot of this macro bottom area. (the Filecoin bottom bowl).
Price will ping pong within these levels. Use them as data points for large term Accumulation such as a Wyckoff schematic preparing for the rise.
---------------------------
Conservative Targets for the bullrun are $100 -$120 Filecoin.
Aggresive Targets are $200 - $400 Filecoin.
---------------------------
Remember the reality of financial markets are they move in proportion to the total market liquidity bowl's growth. Meaning BTC and crypto Total chart must reach higher levels for these tokens inside that bowl to grow larger. They cannot do it on their own. Filecoin is still a little guy in that ecosystem. Even World financial adoption can only pour in so much.
Ill post a Total chart below for you to watch the entire market.
Lets get it.

BITCOIN Bullish Sign - Descending Triangle Pattern.Characteristics of a Descending Triangle:
Lower Highs: The descending trend line indicates that sellers are increasingly willing to sell at lower prices, creating a series of lower highs.
Horizontal Support Line: The support line at the bottom of the triangle shows that buyers are entering the market at a consistent price level, preventing the price from falling below this level.
Current Context:
Potential Breakout: If the price breaks above the descending trend line with increased volume, it could indicate a bullish breakout.
Testing Support: The price is near the support level, making it crucial to watch for a break below this level, which could indicate a bearish move.
Confluences:
1. Support Line: The horizontal support line is around 67,587.5, where the price has tested multiple times and found support.
2. Structure: The 38.20% Fibonacci retracement level is also around 67,587.5 matching support line.
3. Breakout : If it happen will be the third confluence.
Interpretation:
Strong Support Level: The fact that the 38.20% Fibonacci retracement level aligns with the horizontal support line of the descending triangle indicates a strong support zone. This means the level is significant and widely recognized by market participants.
Bullish Potential:
Breakout Confirmation: If the price breaks above the descending trend line (resistance line) with increased volume, it could signal a bullish breakout. This would be further validated by the fact that the breakout occurs from a strong support zone.
Entry Point: A breakout above the descending trend line could be a good entry point for a long position, considering the confluence of technical indicators.
Bearish Risk:
Breakdown Confirmation: Conversely, if the price breaks below the 67,587.5 support level with increased volume, it could indicate a bearish move.
Entry Point: A breakdown below this level could be a good entry point for a short position, as the support zone fails.
FINAL:
Conclusion:
The confluence of the descending triangle support and the Fibonacci 38.20% retracement level provides a strong support zone at around 67,587.5. This level is crucial for determining future price action. Traders should wait for confirmation of either a breakout or breakdown before taking positions and use appropriate risk management strategies to mitigate potential losses.
This setup presents a high probability trade scenario due to the alignment of multiple technical indicators.

SANDUSDT IDEAHello Traders Hope You Are Enjoying Our Analysis. Today We Will Discuss About SAND
(Analysis)
Trying To Breakout Falling Wedge On 1D Timeframe☑️
In Case Of Solid Breakout Expecting Massive Bullish Wave✍️
Keep Eye On It

TON ( toncoin ) tm:1hHello traders.
I hope you doing well.
These areas are based on my personal strategy and I will share it with you.
Open a sell position on the supply area or open a buy position on the demand area.
Your entry point, stop loss, and target point are based on money management and the amount of money in your trading account.
But I promise you that by trading in the areas of my trading strategy, you will definitely make a profit, because these areas, although they seem simple, are my experience of 8 years of learning and trading.
I hope you will achieve maximum continuous profit with me by using supply and demand areas.
Good luck traders.
Mohammad Goodarzi

Bullish AF on $BEER - Solana NetworkThe volume looks good. Perhaps we will consolidate a bit but I have a feeling we will parabolically shoot upward from here.

TAO stair stepping towards $1kThis is my ideal outcome for the next couple of months. Should we break support in the 330-390 zone I have to get out of the trade.

ADA TM : 1hHello traders.
I hope you doing well.
These areas are based on my personal strategy and I will share it with you.
Open a sell position on the supply area or open a buy position on the demand area.
Your entry point, stop loss, and target point are based on money management and the amount of money in your trading account.
But I promise you that by trading in the areas of my trading strategy, you will definitely make a profit, because these areas, although they seem simple, are my experience of 8 years of learning and trading.
I hope you will achieve maximum continuous profit with me by using supply and demand areas.
Good luck traders.
Mohammad Goodarzi

PEPE, will do another UPSIDE attempt..PEPE 4h data is showing another attempt to reverse to the upside. Volume increasing notably at the current price range.
Let's see if it can finally breakout of its descending trendline.
Spotted at 0.0000012500
TAYOR.
Safeguard capital always.

BTC weekly data is shifting. MASSIVE UPSIDE is waiting now! BUY!BTC has corrected healthily to -20% from its peak after reaching its parabolic ATH highs of 73k.
Now the mother of all of coins is showing some strength again. Weekly data metrics is shifting now and buyers are back again, positioning aggressively for the next RUN-UP to ATH and beyond.
From our weekly chart diagram above, you can observe that the black bear cells has faded and the white dot (longs) has literally escaped the shorts prison cell (black cell). This signal has never missed since the 15k BTC season. The batting average of this one playing out again is very very high.
This week is the best time to SEED. Get them all planted now. BTC is already up by 10% after that quick bounce from the strong major order support at 57k area. Signs of what's coming next after this week.
Spotted at 60k area.
TAYOR.

