Bullish on HK/Chinese equities - breaking outBreaking out of long term decline - however might pullback shortly before moving higher
ETF market

SPY Resistance Ahead! Sell!
Hello,Traders!
SPY is going up now
But a horizontal resistance
Around 524$ is ahead
So after the retest we will
Be expecting a local
Bearish move down
Sell!
Like, comment and subscribe to help us grow!
Check out other forecasts below too!

DJIA with US 10yr Treasuries and YenDJIA with US 10yr Treasuries and Yen. Comparing and contrasting all three.

The next decade belongs to Latin AmericaFor the past decade, decision-makers in major banks and multinational companies have been focusing their attention on one of the hottest "growth frontiers": emerging markets.
During much of the 1980's the prospects in most emerging countries were quite bleak: the debt crisis, inflation and domestic political turbulence.
Then a number of "economic miracles" began to pop up, drawing attention to specifically Southeast Asia, the Indian subcontinent, Eastern Europe and toward the end of the 80's, Latin America.
Latin America struggled with the heavy burdens of the debt crisis, hyperinflation, recession and the transition from authoritarian to democratic governments. Most analysts call the 80's Latin America's "Lost Decade." Most governments in the area came to the realization that they were gradually becoming irrelevant to the investment decisions of major international players and that they would slowly but surely lose ground to Asia and Eastern Europe in the competition for capital and employment opportunities. The region's trade with the rest of the world increased but at a slower pace than in countries at similar stages of their development. Latin America largely remained an exporter of primary goods. In fact, beside the popping off of just particular industry sectors and multinational companies, Latin America never saw a bullrun as a continent.
After lagging behind big players like India and China during the Era of Markets (1989–2019), where there was a remarkable increase in global economic interconnectedness and rapid adoption of digital technologies, now it's time to shine for Latin America and to catch up to OECD economies.
The next decade is expected to be a transformative period for Latin America with many countries experiencing rapid growth and development.
Economic Growth : Latin America's economic growth is expected to continue, driven by a combination of factors such as increased trade, investment, and infrastructure development. The region's large and growing middle class is also driving consumer spending and demand for goods and services.
Regional Integration : Latin America is also expected to strengthen its regional integration, with initiatives such as the Pacific Alliance and the Mercosur bloc aiming to promote trade and cooperation among member states. This will help to increase economic competitiveness and attract foreign investment.
Demographic Dividend : Latin America is experiencing a demographic dividend, with a large and growing population of young people entering the workforce. This will provide a significant boost to economic growth and innovation, as well as help to address social and economic challenges.
Innovation and Technology : Latin America is also expected to become a hub for innovation and technology, with many countries investing in digital infrastructure and innovation hubs. This will help to drive economic growth and create new opportunities for entrepreneurship and job creation.
Emerging countries now represent the clear majority of the world's population. Their growth prospects range from 4 to 5% per year in Latin America, 6 to 7% in East Asia and up to 10% in China. These are typically two to three times the expected growth rates of developed countries.
In all of these countries, growth will invariably entail the expansion of new middle classes, with outsized needs for consumer durables, housing and mobility.
The MSCI Emerging Markets Latin America Index e.g. captures large and mid cap representation across 5 emerging markets countries in Latin America. This index is one of the most trusted measures of how these stock markets in the region are performing. However, all the constituent countries do not have a proportional representation in the index. The country weights in the MSCI Emerging Markets Latin America Index are mostly Brazil 46.6%, Mexico 36.51%, Chile 9.79%, Colombia 4.17% and Peru 2.93% with sectors like materials, energy, consumer staples, common services and financials.
Looking at the Index from a technical macro standpoint we can see clearly almost 20 years of an (Wyckoff) accumulation period (with the launch in 1990 probably even longer) and sideways movement resulting in a kind of created bull flag signaling a continuous coming-in of buyers and losing steam of sellers.
Furthermore the monthly RSI is printing higher lows and higher highs which is an indicator for a steady uptrend and positive momentum shift towards the upside.
No doubt, Latin America is gonna flourish the next decade(s) marking a significant transformation, with the region poised to emerge as a major player on the global stage.

QQQ What Next? SELL
My dear subscribers,
This is my opinion on the QQQ next move:
The instrument tests an important psychological level 442.04
Bias - Bearish
Technical Indicators: Supper Trend gives a precise Bearish signal, while Pivot Point HL predicts price changes and potential reversals in the market.
Target - 433.35
About Used Indicators:
On the subsequent day, trading above the pivot point is thought to indicate ongoing bullish sentiment, while trading below the pivot point indicates bearish sentiment.
———————————
WISH YOU ALL LUCK

SPY: Short Signal Explained
SPY
- Classic bearish formation
- Our team expects fall
SUGGESTED TRADE:
Swing Trade
Sell SPY
Entry Level - 520.83
Sl - 525.68
Tp - 511.78
Our Risk - 1%
Start protection of your profits from lower levels
❤️ Please, support our work with like & comment! ❤️

SPY looks primed to breakthrough resistance and new ATHSPY looks primed to breakthrough resistance and new ATH
Price needs to break the the resistance to get on its way to new ATH.
We believe it will smash through the resistance.
Momentum looks bullish, RSIs trending upwards
Are you buying?

SPY bearish pattern forming...targeting 460 levelSPY is forming bearish level, could be double top or a rising wedge...

XLF- Nope Nothings ChangedXLF....
I could on long diatribe about the Banking sector and financials and the economy...
But I'm not
You want to know why? (i'm going to tell you regardless)
It's because deep down you know that the Banking system is a house of cards and these Bankers..JUST..CANT..RESIST..THEMSELVES
SHORT XLF...for now...and then a Big Short (pun intended) later
(i'll show the "later" on anther chart at a later time...hint see that big horizontal white line well below the "C"...thats the destination for the other "later")


Donald Trump won't let SPY dumpIt's totally rigged, and this proves it. AMEX:SPY should be on the ground right now, but it's near ATH.

BITU shallow pullbackBITU - channel resistant , short to target 28 where 4h demand exists. Not look for staying short too long on this one. It will eventually break the channel to the upside. Will update chart when long signal happens.

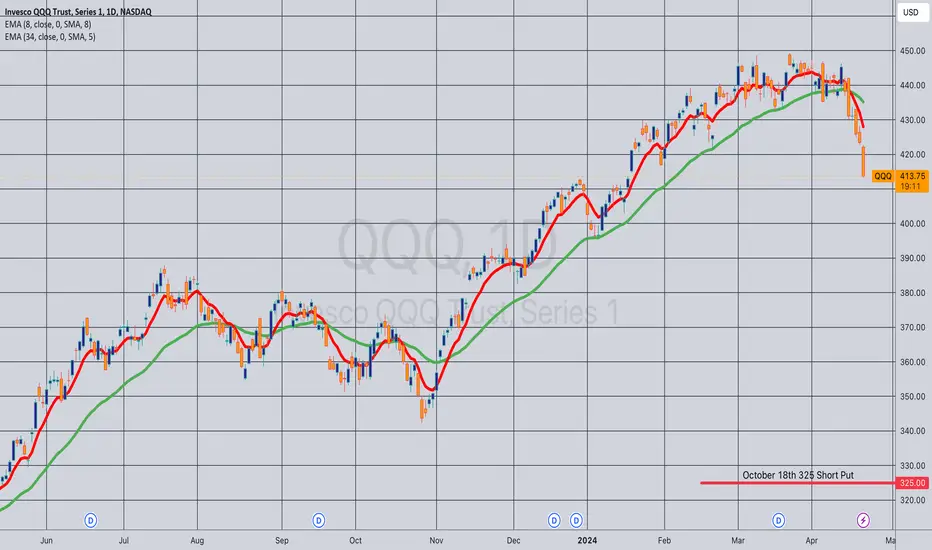
Opening (IRA): QQQ October 18th 325 Short Put... for a 3.52 credit.
Comments: Adding a rung out in Q4 here with QQQ IVR at 81.0, targeting the <16 delta strike paying around 1% of the strike price in credit.
Will generally look to manage shorter duration rungs as I come to them ... .
GLD - Time to Take Some off the Table?While I'm still looking for higher prices, eventually, recent gains are too good to pass up. Line chart shows a three week testing of the high and at the moment, appears to be failing. Big move the past couple of days including this morning tried to push prices higher but this morning's big move was met with selling taking it off of overbought highs.
Looking for some pullback to test the 200 level.

GOLD MINERS GDX - 4 Years of pain?A inverse #HVF appears to be in progress on the #GDX
@TheCryptoSniper
Coincides with a probability that gold has put in a major secular top being pushed down by positive real rate environment.

5/10/24 - MEGA SHORT time sensitive - $jets $qqq $soxl $vixydo yourself a favor and look into this incoming CME from the sun.
youtu.be/9QCA3jouCKk - it's a short video WATCH IT NOW
6 or 7 earth bound flares that each have the capacity to f things up massively.
the reason this matters is it's a DOWN ONLY situation. the market doesn't know about this (clearly) so any non-event doesn't move the market "back up". many sources i look at suggest the deep negative event is 10%. could be higher for a disruptive event 20-30%.
EVEN IN a 10% disruption event, the market is looking very weak ON IT'S OWN and awaiting a pin. the flip flop from economic data is a DISTRACTION from something like this that trumps all...
jets - GROUNDED. FEAR. LEVERAGED. THEY GET DUMPED FIRST.
qqq - the richest valuations and the most affected by EMP style pain
soxl - the sector within the q's that is even more heady but doesn't have any 'pin' bc ai is strong narrative (i subscribe to this btw, but ST it's run hard)
vixy (go long not short like the above) - 0dte's have basically replaced the need to buy short term vol. HOWEVER the scenario where this gets disrupted is a CAN'T SEE THRU scenario - of which "this" is one of those
PLEASE post comments and let's discuss this. it's perhaps the most EV positive trade i've ever seen even if the scenario is a 10% one. i believe it's foolish not to participate in this and/or hedge responsibly. ignore this at your peril and flip the coins. but really - don't. let's help each other stay safe fam.

5/10/24 - MEGA SHORT time sensitive - $jets $qqq $soxl $vixydo yourself a favor and look into this incoming CME from the sun.
youtu.be - it's a short video WATCH IT NOW
6 or 7 earth bound flares that each have the capacity to f things up massively.
the reason this matters is it's a DOWN ONLY situation. the market doesn't know about this (clearly) so any non-event doesn't move the market "back up". many sources i look at suggest the deep negative event is 10%. could be higher for a disruptive event 20-30%.
EVEN IN a 10% disruption event, the market is looking very weak ON IT'S OWN and awaiting a pin. the flip flop from economic data is a DISTRACTION from something like this that trumps all...
jets - GROUNDED. FEAR. LEVERAGED. THEY GET DUMPED FIRST.
qqq - the richest valuations and the most affected by EMP style pain
soxl - the sector within the q's that is even more heady but doesn't have any 'pin' bc ai is strong narrative (i subscribe to this btw, but ST it's run hard)
vixy (go long not short like the above) - 0dte's have basically replaced the need to buy short term vol. HOWEVER the scenario where this gets disrupted is a CAN'T SEE THRU scenario - of which "this" is one of those
PLEASE post comments and let's discuss this. it's perhaps the most EV positive trade i've ever seen even if the scenario is a 10% one. i believe it's foolish not to participate in this and/or hedge responsibly. ignore this at your peril and flip the coins. but really - don't. let's help each other stay safe fam.

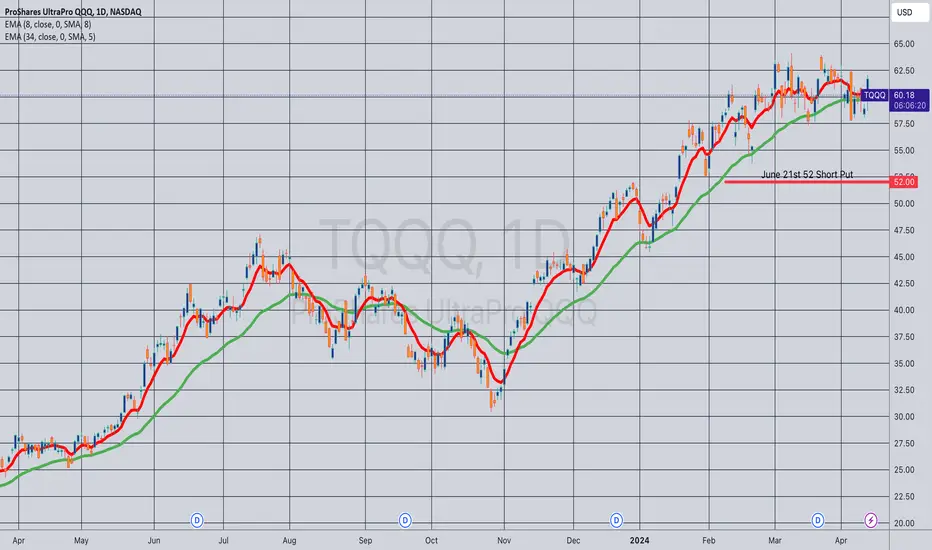
Opening (IRA): TQQQ June 21st 52 Short Put... for a 2.49 credit.
Comments: Adding to my TQQQ position on weakness ... . This is a bit longer-dated than I like to go with shorter duration premium selling, which I like to keep in that 45 DTE wheelhouse, but May has now only 35 days in it, and I like to stick to monthlies in all but the most options liquid underlyings.
Will generally look to take profit at 50% max. I'm fine with being assigned, then proceeding to sell call against if that occurs.
Metrics:
BPE/Break Even: 49.51
Max Profit: 2.49 ($249)
ROC at Max Profit: 5.03%
ROC at 50% Max: 2.51%
Delta/Theta: 24.36/3.37
Opened (IRA): TQQQ May 17th 55 Monied Covered CallBought a one lot of shares and sold an in-the-money -75 delta call to emulate a 25 delta short put to take advantage of call IV skew and to have built-in pro via the short call.
Metrics:
Break Even/Cost Basis in Shares: 52.71
Max Profit: 2.29 ($229)
ROC %-age at Max: 4.34%
ROC %-age at 50% Max: 2.17%
Will generally look to take profit at 50% max, add at intervals at a strike/cost basis better than what I currently have on should weakness present itself.

top of volume range band end of day?probably the influx of money into biotech this morning has a rippling effect all day on this etf as it retraces above its gap to sell off levels again.

TQQQ 6/26/2023Keeping it simple
TQQQ Multi-time frame analysis
Daily chart – Long term
Pretty clean straight forward chart. In this one we can see the different stages of the market.
After topping out in Aug. ’18, price entered a “sideways” market between Aug.’18 – May’20. The “sideways” market was deemed an Accumulation stage after price broke upwards and entered Uptrend.
In May’20, price entered its Uptrend after breaking out of an Accumulation stage. During this time, you can see price respect the 200ema the whole way.
The Uptrend ran between May ’20 thru Nov.’21. After topping out Nov.’21, price starts to move sideways until it breaks below 200ema Jan.’22. This breakdown deemed the “sideways” market as a Distribution stage and confirms the start of the Downtrend.
Price has been in a Downtrend since and continues to make lower highs and lower lows. Facts that can’t be argued.
The price slide continued until it reached the breakout point of May’20. At this level it found support and bounced breaking above the 200ema and breaking above resistance and previous lower high.
Does this mean the Downtrend is over? Absolutely not. Why? This is the 1st time the previous lower high has been tested.
I will now look at some indicators to provide further confirmation.
The Stochastic indicator - has been Overbought for a while and it’s coming down while being at a resistance level. Bearish.
The MACD indicator - is crossing below its signal while price is at a resistance level. Bearish
Price rejection/ false breakout – Price was above the previous lower high price(Resistance) but has now fallen below it. This is very bearish as price is rejecting higher prices.
So currently we have the following: Downtrend + Oversold stochastic + Macd under signal + Price rejection
This equals to a high probability short trade. I will zoom into 15min chart for entry.
15min chart – Short term
Here we can get a closer look at what’s going on short term.
Price has been on an Uptrend (respecting 200ema) since May 5, ’23 and topped out June 15th 2023.
Here we can see the “Price rejection” we saw on the Daily chart and its a Head and Shoulders reversal pattern in the 15min chart!
As you can see, the neckline has been broken to confirm the Head and Shoulders reversal pattern.
Entering trade short.
Entry: 37.30
Stop loss: 41.05, -10.05%
Target #1: 27.70, +25.75%, 2.56 RR ratio
Target #2: 17.67, +52.63%, 5.23 RR ratio

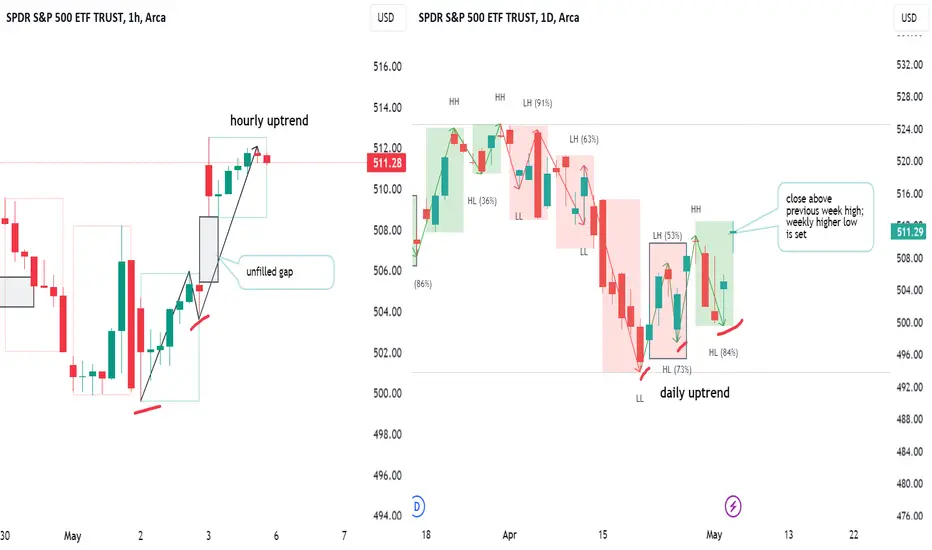
S&P Bulls prove their controlThe strong close last week indicates a shift in control to the buyers. They managed to close above the previous week’s high, establishing a weekly higher low and confirming the daily uptrend. Currently, the bulls have control across all key timeframes: the price is trending upward on the hourly, daily, weekly, and monthly charts. The only challenge they face is on the monthly timeframe, where bears have initiated consolidation; however, this is not a critical issue.
It's plausible that the bulls might either retrace the entire bearish wave or, more likely, close May as an inside bar, setting a price equilibrium that could persist throughout the summer. Given this scenario, the current position might not be ideal for a long entry since we are in the middle of April’s range. If you're considering buying, it would be wiser to wait for a pullback that could provide a more favorable opportunity.
Disclaimer
I don't give trading or investing advice, just sharing my thoughts.