Massive huge buy volume spottedMassive huge buy volume spotted on weekly chart. Something is brewing.
Monthly chart and moving averages are pointing to an upward trend.
CG trade ideas

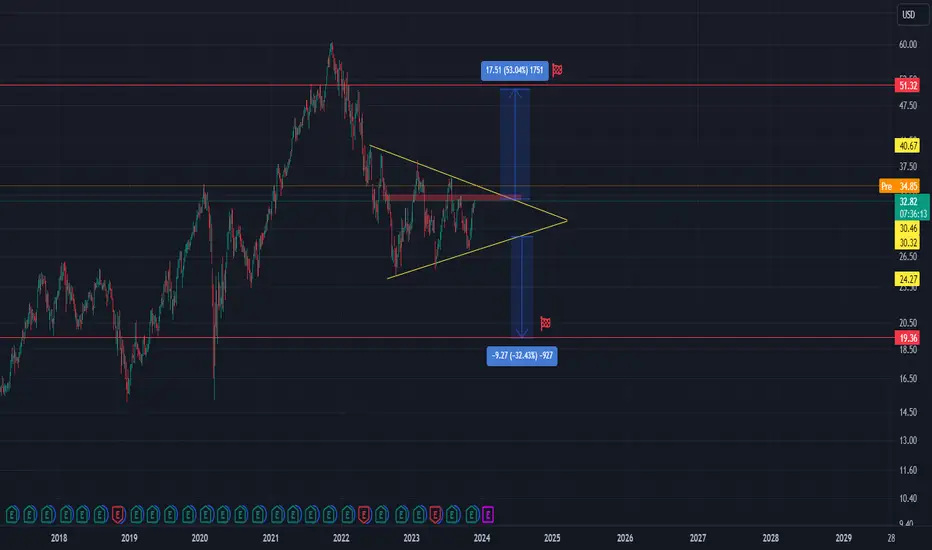
Carlyle Group Neutral Pattern Carlyle Group stock was named to join the S&P MidCap 400, effective prior to the start of trading November 30. Therefore I expect breaking of this symmetrical triangle pattern soon. In case there is a bullish break out from here, price target is 53% rise in price. On the other side there is still big resistance in this area where we could see a rejection and possibly break to the downside. If this scenario happens, price target is 19.36$ which represents a 32% drop in price.
LUCKILY THE TEST TACTIC SUSTAINEDIT TOOK MONTHS OF PREPARATION.
A LITTLE OVER A YEAR AGO... NOTICED VERY PECULIAR PATTERNS ON A LOT OF VERY STURDY CHARTS. EXAMINED NEARLY 400 TICKERS... SOMETHING VERY IMPORTANT STOOD OUT.
DID SOME CALCULATIONS AND TESTED THE THEORY WITH A LIVE PORTFOLIO.
WHEN THE BANKING CRISIS STARTED PACKING IN, THE PORTFOLIO WAS RED AT FIRST. THEN EVERYTHING WENT GREEN... AND STAYED GREEN. LIKE M A G I C.
THE BANKING CRISIS WAS PERFECT FOR THIS PORTFOLIO TYPE.
VERY TUNED IN. EVERYTHING WORKED JUST AS PLANNED.
THERE ARE PLENTY MORE TO GO...
WILL TEST OUT THE LONGEVITY NOW.
WE ARE IN A CYCLE AND IT'S CLEAR AS DAY.
Strange things can and will happen.
The performance of our markets are extraordinarily fascinating!
Watched the market throughout the 2020 fallout... iT was nothing short of miraculous.
We are all lucky.
Count your blessings.
Take care.
P.S. Let's not get too excited. We have work to do!

CG - Head and Shoulders Idea showing a right shoulder forming on CG
This right shoulder takes price down to the green support line on the horizontal
The vertical line shows the head structure of the head and shoulder

$CG with a Bullish outlook following its earnings #Stocks The PEAD projected a Bullish outlook for $CG after a Negative over reaction following its earnings release placing the stock in drift C with an expected accuracy of 100%.

CG POSITIVE RSI DIVERGENCE WAVE B LOW THE positive r14 day rsi has now setup what i used to hear from one of my good friends and mentor the late peter deserio from ew land a BALLOON UNDER WATER tends to jump up and out of the water !!!

CG and TROW charts MOVE TO 100 % net long wave C rally The other day I covered ALL short and all puts as the market reached a very very over sold level in just 5 trading days I made a PROFIT based on the move from 90 to 110 % short at 4244 to 4285 area and took the profit . simple reason the MCO model was at a level I could not be short in fact I went long 25 % at 4130 and now moved that to75 % net long 4150 NO stop I also moved to a 100 % net long the other day in CG at 33.50 even .I am looking for a wave C up or a 2 but tend to view this drop as wave B down . I have had major spiral s 3 point to a top due 16 th to 25 of aug

$CG with a Bearish outlook following its earnings #Stocks The PEAD projected a Bearish outlook for $CG after a Negative Under reaction following its earnings release placing the stock in drift D with an expected accuracy of 60%.

CG Double TopNASDAQ:CG looks like it is collapsing after forming a double top and breaking a trendline.

Long | CGNASDAQ:CG
Possible Scenario: LONG
Evidence: Price Action
TP1~ FREE STYLE,
It's at ATH, so I will put small money for OTM Call options, it has more than usual risk/reward
Call options, Strike 49$, 06/18/21
* I'm not a financial advisor and it could be wrong 100%.

$CG My Favorite Focus chart for the weekwell defined Cup with handle. watching this one very closely for an entry trigger.

BUY to CARLYLE GROUP DailyHey guys, CARLYLE GROUP is a bullish configuration, it has broken a compression zone from the top on the trend line above. We can see that the last candle made a pull back, an abortive attempt at an increase with great certainty to seek the next last higher.
Then a drop if the sellers refuse the price offer volumes.
Please LIKE & FOLLOW, thank you!

Tear-gas maker might continue to rise amid unrestMaybe too late for this trade, but I learned today that Carlyle Group subsidiary Combined Tactical Systems makes about a quarter of the less-lethal munitions used by police in the recent suppression of rioters and protesters in the United States. As long as unrest continues, this will likely continue upward. Not exactly the ethical/ESG trade of the year, though.


Low Volume Gap Fill$CG heading through a low volume zone as price leaves POC
Added next month $27 C for .45 & likely to add on a pullbacks

United Road Acquires Team Drive-Away, Expands into Heavy-Haul VeCG: United Road
2019-10-21 07:20:00
United Road Acquires Team Drive-Away, Expands into Heavy-Haul Vehicle Segment

Trade #002 - Opportunity to join the uptrend on CGEntry: 23.33
Protective Stop: 22.25
Safety Target: 25.49
Final Target: 29.09
Long Term Trade


The Photography Stocks Industry - 01The Photography Stocks Industry - 01
Correlation between CG and SSTK.

CG: Sort opportunityAn intraday high potential, Back Tested Sort Analysis.
We ll try to enter into the correction of the uptrend movement.
DETAILS ON THE CHART
NOTE: Entry range area above the entry point, is calculated upon 80% of the recorded pullback back tested past performances
DISCLAIMER: This is a technical analysis study, not an advice or recommendation to invest money on.

The Carlyle Group L.P. - Support & GartleyThere is a strong support level at 19.95. The price respected that level multiple times and it is expected it will do again. Moreover, the Gartley pattern was formed, which increases the probability of this setup.
T1 – 38.2%
T2 – 61.8%


CG Bullish SwingStock is breaking out of a channel. Great volume with a bullish gap. Retest gap, so wait for the pull back. Looking for the 200 EMA and the support/resistance level to hold it up. Also had great volume on the gap.
