NAS100 trade ideas

US100Nasdaq index analysis
1 hour time frame
The price can move to the bottom of the 1-hour range and from there return to the top of the 1-hour range.

CHART BREAKDOWN NASDAQ: Key Levels, Targets and Thoughts!Trade Update: GBP/USD
We have some great news on our recent GBP/USD trade! 💲
After analyzing the market conditions and identifying a solid setup, our trade has successfully Hit Take Profit 1 (TP1). This made sure that the majority of our positions have been secured and cashed out some of our gains, allowing us to lock in profits and reduce risk.
Following this, we moved our stop loss to breakeven to ensure no loss on the remaining position. This strategy not only protects our capital but also gives us the opportunity to capture further potential gains with zero risk on the table and cashing out on TP2s and TP3s.
Stay tuned for more updates and happy trading! 🚀

Risky short before NY sessionI expect little short from lower high before NY session for 50 pips. Lets see...RRR 2/5, CMOOON.

US100US100 is in bullish trend.
Potentially printing HH and HL.
No sign of reversal here .
We buy at CMP

US100 - Bearish US 100 is exhausted on the 4 hour and 1 hour chart and making its low momentum successful.
There is a very strong divergence on the 4 hour and 1 charts and 2 significant lower lows and lower highs. What do you guys think of this idea. Lets hope for good. Thanks


Nasdaq Not Over Yet !Hi mates sharing a long view on Nasdaq as price break resistance (18350) and sustaining very well above and by the today's candle price breached the high of breakout candle too which is a good sign for resistance breakout so from here onwards i am looking some more upside movement in coming sessions friends. Traget meausured from the swing high to swing low made before this breakout and by the rising resistance line too and it seems logical too me.
Breakout retest- So as we can see that a proper breakout retest not happened so far after breakout which could provide the best entry as we can minimize our risk in any of trade by these type of retest entries as price earlier retested too it's breakout mentioned on provided chart, Rest i will update idea accordingly whenever needed and good to share anything about this publication.
This idea is meant for only educational purpose this not any kind of trading or investment advice.
Best Regards- Amit


Melt-up in securitiesHaving handled the decline, the markets now seem to be on the verge of a melt-up. We are already seeing it in European securities and industrials. However, I think the risk reward is best in Nasdaq, where I think we will trade at least 15% by the end of Q3. Looking at some data, it seems that fund managers are again underinvested in equities, which limits the downside.
I would position with a tactical long in NDQ-futures. With a risk/reward of 5 - risking 10% of my capital.


NDQNice to meet you. SEOVERIGN - This is SeoVerign.
Nasdaq is expected to fall after a five-wave formation.
Please refer to TP 1 and 2.

NASDAQ BUY NOWHi Traders we have NASDAQ BUY TRADE we have been on Uptrend since 3 May. We have hit Higher High and retest on higher low.
Entry Reason Higher low act as support level
H1 Bullish Engulfing
Moving Average
Please share your results and comment.
Certified Price action king

NAS100 SELL 1 HOUR TIME FRAMESTRONG SUPPLY ZONE
Price has to feel the gap below
Expecting a 5:1 reward,
Let's see!

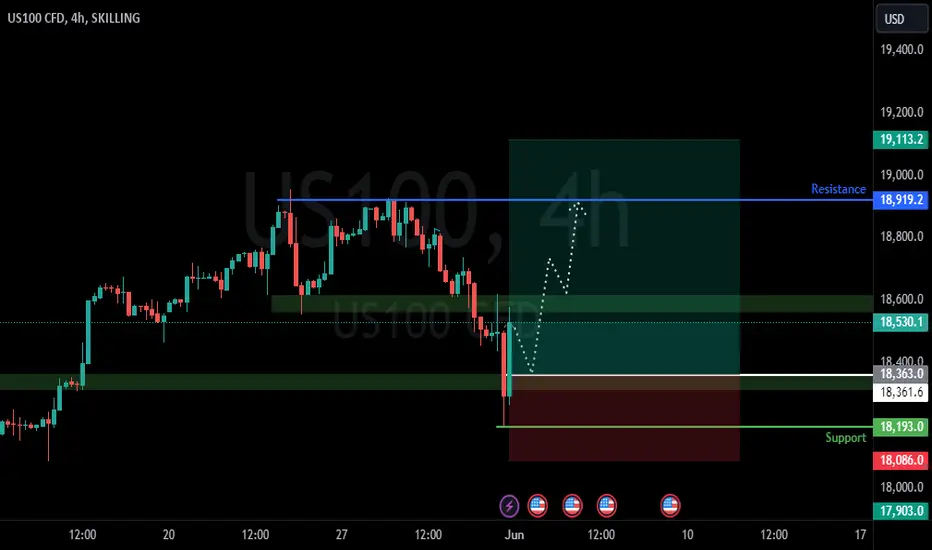
NasdaqPrice gave very good movement, nearly 300 points yesterday and now it is at crucial zone. 18600 is important in deciding the trend direction.
Buy above 18630 with the stop loss of 19590 for the targets 18660, 18700, 18740 and 18800.
Sell below 18550 with the stop loss of 18590 for the targets 18510, 18480, 18440 and 18400.
!8500 can act as support.
Hit the like button to Rock !! Show some energy !!
Note : This is my pre market analysis and my trading journal. Not a suggestion to buy or sell.
You are responsible for whatever you do.


NASDAQNASDAQ: Sell
Open: 18660
SL: 19000
TP1 : 18000
TP2 : 17700
TP3 : 16700
================
Disclaimer: Any content in this text does not constitute investment advice. This text provides an objective description of the market situation and should not be considered an offer to sell or a solicitation to buy.
Any decisions made based on the information provided in this text are your personal responsibility. Any investments made or to be made should be analyzed based on your financial situation and personal goals.

USTEC SELL Monthly Structure Analysis and Trade SetupThe USTEC monthly structure on the daily timeframe is represented by OHLC, indicating a Sell Setup . We are currently waiting for a bearish TDI cross on the daily chart to confirm the presence of sellers in the market. Additionally, the candle formation at the high is an evening star pattern, which signals a potential reversal .
If the trade moves in our favor, I have identified three take profit targets:
1. First Take Profit: 18,485.24
2. Second Take Profit: 18,193.98
3. Third Take Profit: 17,958.57
Trade with caution. If you find this post useful, please like, follow, share, and leave a comment.

Nasdaq longNasdaq made another buy conformation for more pushups on its way this is also correction on longterm we look for sell only this is correction

US Nas_ 100 _ Update _ Prices _ Under _ Trading _ Venue _ OANDAUS Nas_ 100 _ Update _ Prices _ Under _ Trading _ Venue _ OANDA
The retest was pretty much useless as it did not finish the correct area.
We will still expecting drop to the red area after the support confirmation:
Support confirmation over week 4, May:
$18,954.8.
Then will need to drop to the red area, even if go to the higher prices still must come own to finish the correct retest.
Once the retest is done we will be expecting following prices:
$19,096.5
$19,165.6
$19,195.7
$19,231.1
$19,250.6
$19,282.5
$19,296.7
$19,341.0
Distribution price: $19,358.7.
Market from here will take a short break.

US Nas 100 _ Most _ Secure _ Trading _ Strategy _ Under _ TradinUS Nas 100 _ Most _ Secure _ Trading _ Strategy _ Under _ Trading _ Venue _ OANDA
Retest must hold within the key level of : $17,947 , $17,794.4, if support is not confirmed then we will be going as low as $17,354
B = Buy
S = Sell
If you're a professional trader then you'r first level of entry is at $17,824, otherwise, your safe secure level of confirmation is $18,090.2. Then simply follow each retest until market arrive at the advance Stage.
B : $17,824
S: $18,253.7
First trade executed
__________________
B: $17,947
S : $18,396.9
Second Trade Executed
_____________________
B: $18,090.2
S: $18,928.6
Third trade executed
_____________________
B : $18,253.7
S: $19,153.5
Forth Trade Executed
____________________
B: $18,621.8
S: $19,77.2
Fifth Trade Executed
_____________________
