US02Y trade ideas


Verifying the consolidation; USDJPY, CPI and US GOVT. 2Y YIELDSThe Chart is of the 2y Govt. Bond yields which is positively correlated to the CPI and to the USDJPY pair, with correlation coefficient of >0.8. This is because, inflation is directly related to debt and investment yields and Japan is the second largest US debtor. All three charts are consolidating which would mean that there's still a fog of uncertainty into the future of the greenback. A new administration, the Yen's unresponsiveness to stimulus and a US inflation of 2.4 are all contributing factors.
I attached links to articles in my previous post so like and follow to keep up!
Trade Safe!

This sell signal means: buy US2y vs sell SchatzBuy the US/German 2y bond spread!
Shd the Schatz yield itself retest the -0,72/-0,78 range again, then it will likely be an outright sell too! (pls see lower panel referring to German 2y yield)

US/German 2 year yield spread - Watch price action at the cloud!US 2y Note yield: 1,256 %
German 2y Schatz yield: -0,808 -> yes, it is still deep negative :-)
Spread between the two markets are at highs, trading around 205 basis points.
Reasons we all know: FED started to hike, while ECB is still sticking to its NIRP and QE policies. However this will change one day, and then the spread collapse will be quick and sharp.
Technicals to watch:
Weekly:
- Bullish trend, which means US2y being sold while Schatz is still extremely strong bid, so the spread goes wider, more positive.
- Ichimoku is bullish, but the spread is a bit distant from its 180 bps equilibrium.
- Heikin-Ashi shows indecision. A doji candle this week, haDelta crossed up, haDelta+ has not yet as that reacts later. All quantification tools are below their center lines.
- EWO is bullish
- Depending on next few weeks price actionaround Tenkan Sen (green line - 9 weeks average), there is some possibility for a small H&S pattern to develop. (unless it spikes much higher above Tenkan)
Daily:
- Ichimoku is neutral: Price is in the Kumo cloud, between flat Tenkan and Kijun. Tenkan and Kijun are also at the level of the cloud. Forward Kumo is thin.
- Price retested Kumo from the highs, now we see some consolidative spike back to Kijun. Not bullish until the spread holds below 210-213 bps.
- Watch Heikin-Ashi signals and price action in the red rectangle. A break below 200 bps could open space to spread tightenning towards the 180 bps weekly equilibrium.
haOscillator looks topish, haDelta may turn lower as well.
- EWO is bearish: my basic approach is that until price is below Kijun and EWO is red, I only look to sell spikes to supp/res levels. Yesterday I managed to put on a small short at 209 bps. I will size it up in case of a lower break below 200 bps.
The big short on this spread is still far away. That will only happen when ECB really steps on the break and rises base rate back to at least 0 %. But a small short might be around the corner.

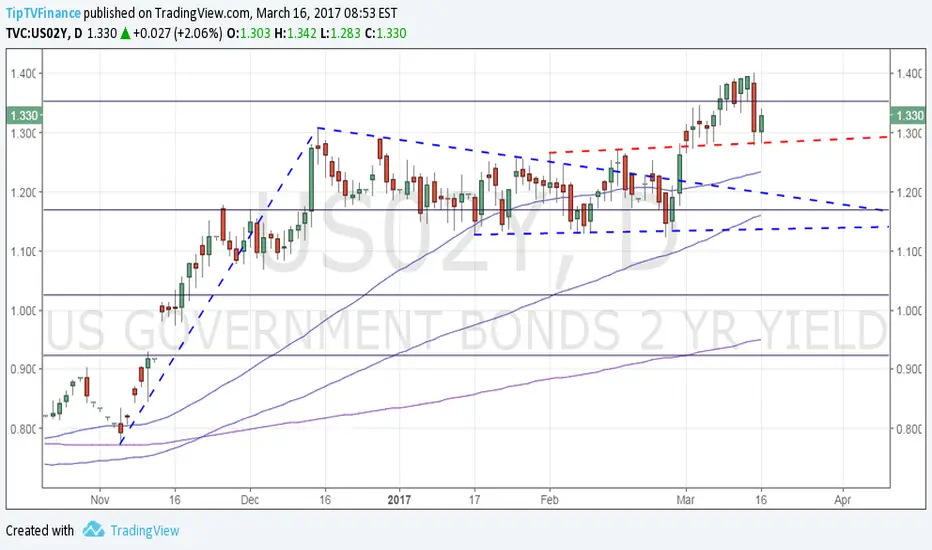
US 2-year yield: Former resistance offering supportThe yield found support at 1.28% (former channel resistance) yesterday and has staged a rebound to 1.33%.
The major averages - 50-DMA, 100-DMA and 200-MA are all sloping upwards and nicely aligned (one below the other) suggesting the long-run view remains bullish.
long usdSee the liltte reverse , 3year bond yield auction is selling at 1.43% let's see 2year yield 1.7% . assuming usd will start to higher from this point, long dollar against jpy,eur cad aud nzd would be a nice trade.

