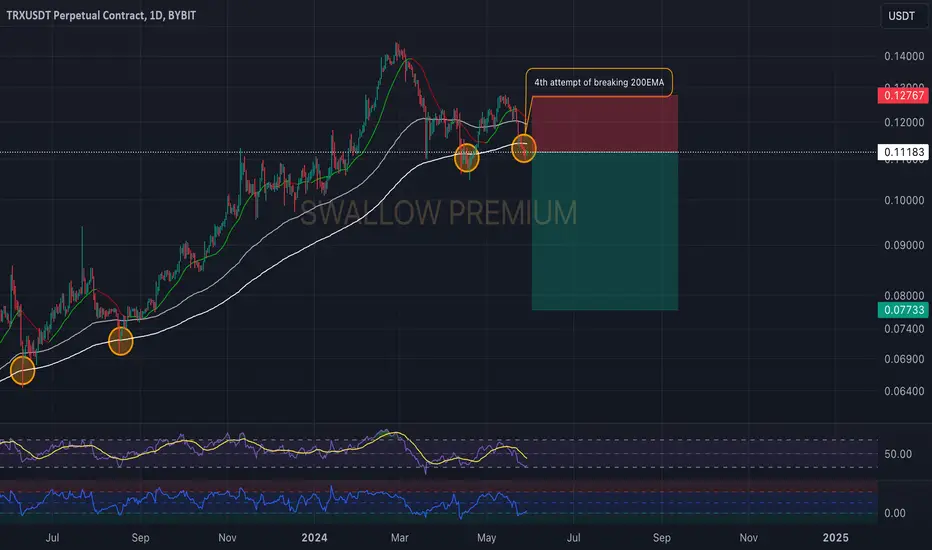
Tron (TRX): 200EMA Been Broken!Tron is yet again at 200EMA trying to break this 4th time.
We are looking for a successful breakdown here, which would result in a strong downward movement!
Swallow Team
TRXUSDT trade ideas
TRX → be sure! buy it!hello guys...
I think TRX will be bullish for these reasons:
1- it made a quasimodo pattern!
2- it is on the flip area!
3- It somehow reacted to the bottom line of the channel!
the target will be $0.133 and $0.19.
___________________________
✓✓✓ always do your research.
❒❒❒ If you have any questions, you can write them in the comments below, and I will answer them.
❤︎ ❤︎ ❤︎And please don't forget to support this idea with your likes and comment

TRX limit orders ?TRX to bounce off ascending grind line ?
Also interception at prior support level on to the ascending grind lines
Go long if you get a hammer off this level?

TRX, the UPSHIFT has started, the whole CRYPTO will SURGE!AMEX:TRX
DO YOU SEE WHAT I SEE?
MASSIVE ALERT!
When TRX reverses to the upside, It means the whole crypto market is preppin to move with it. USDT inflows will pick up pace signaling a buying spree event. Expect more than average upside momentum from this point onwards. Historically, this signal never misses. TRX moves first in advance, then the market gets moving after a while. Just like January 25, 2024 (BTC from 38k to 73k journey), TRX started ascending, then the market gets wild after a few days.
Get ready.
TAYOR

TRX ( TRON ) tm:1hHello traders.
I hope you doing well.
These areas are based on my personal strategy and I will share it with you.
Open a sell position on the supply area or open a buy position on the demand area.
Your entry point, stop loss, and target point are based on money management and the amount of money in your trading account.
But I promise you that by trading in the areas of my trading strategy, you will definitely make a profit, because these areas, although they seem simple, are my experience of 8 years of learning and trading.
I hope you will achieve maximum continuous profit with me by using supply and demand areas.
Good luck traders.
Mohammad Goodarzi

TRX signal#TRON :small_red_triangle_down: moves in an ascending channel in the daily time frame and is in correction mode in the 4-hour time frame.
The price is close to the $0.11120-$0.10520 support area, which is a strong demand area.
Its long-term trend is upward, and the short-term trend is downward. To stabilize the upward trend in the 4-hour time frame, the price must break the dynamic resistance.

Technical Analysis of TRX/USDT Chart (Tron/Tether) Key Levels in the Chart:
1. **Support Areas (Green Zones):**
- Near the $0.080 level: This zone acts as a strong support, with price reacting to this area multiple times.
- Near the $0.060 level: Another strong support zone that has held up the price in the past.
2. **Resistance Areas (Red Zones):**
- Near the $0.120 level: This area has acted as a significant resistance where the price has struggled to break through.
- Near the $0.180 level: Another resistance zone which the price has tested but not broken.
3. **Liquidity Levels (LIQ):**
- **Daily Liquidity Levels:**
- $0.03330: A lower level of liquidity on a daily scale indicating potential buy orders.
- **Weekly Liquidity Levels:**
- $0.01431: A weekly liquidity level indicating potential buy orders.
- $0.22890: A weekly liquidity level indicating potential sell orders.
Other Key Points:
- **Change of Character (Choch):**
- The first Choch occurred near the $0.020 level, indicating a trend change from bearish to bullish.
- A potential second Choch is marked around the $0.060 level, indicating a potential trend change.
- **Break of Structure (Bos):**
- The first Bos occurred near the $0.030 level, indicating a break of resistance and the start of a bullish trend.
- The second Bos is marked near the $0.16767 level, indicating a potential break of resistance.
Technical Pattern:
- **Consolidation:**
- The price has shown periods of consolidation between the marked support and resistance zones.
- This consolidation indicates indecision and potential build-up for a significant move.
Trend Analysis:
1. **Bullish Scenario:**
- If the price breaks above the $0.180 resistance level, it could move towards the $0.22890 weekly liquidity level.
- Target levels in this scenario:
- $0.180 (Resistance Area)
- $0.22890 (Weekly Liquidity Level)
2. **Bearish Scenario:**
- If the price breaks below the $0.080 support level, it may move towards the $0.060 support area, and potentially lower towards the $0.03330 daily liquidity level.
- Target levels in this scenario:
- $0.080 (Support Area)
- $0.060 (Support Area)
- $0.03330 (Daily Liquidity Level)
Volume Analysis:
- **Volume:**
- Volume analysis indicates decreasing volume during consolidation, suggesting a lack of strong momentum. An increase in volume on a breakout could confirm the start of a new trend.
Conclusion:
The TRX/USDT chart indicates a consolidation phase with potential for significant moves upon breakout from key levels. Traders should watch for breakouts from the marked support and resistance zones to identify potential trends. Support and resistance levels are crucial for decision-making, as their breakage can signify important market movements.

TRXUSDT COULD PUMP A BITHey, what's up fellow traders i think i found something that i can share with you. Though nothing is guaranteed here but i guess this gonna happen.... DYOR

TRX trade setupTron (TRX) is one of my favourite coins which I choose to invest in.This is trade (investment) setup on larger timeframe. I am not looking to reach targets 2,3,4 and 5 very soon, that could be year(s). I will sell most of my capital on targets 3,4 and 5. Small portions will be sold on targets 1 and 2.
Entry Zone: 0.27 – 0.34
Buy Zone: 0.024 – 0.03
Target 1: 0.11 – 0.12 (102%)
Target 2: 0.14 – 0.14 (151%)
Target 3: 0.17 – 0.18 (211%)
Target 4: 0.24 – 0.25 (335%)
Target 5: 0.31– 0.32 (454%)

TRX long ALL trading ideas have entry point + stop loss + take profit + Risk level.
hello Traders, here is the full analysis for this pair, let me know in the comment section below if you have any questions, the entry will be taken only if all rules of the strategies will be satisfied. I suggest you keep this pair on your watchlist and see if the rules of your strategy are satisfied. Please also refer to the Important Risk Notice linked below.
Disclaimer

TRON BUYon the higher timeframe there is a breakout on Tron
We are at a major key level in the market, we have a corrective push to the downside now I'm expecting buys to the upside

TRX: On the Verge of Breakout - Will Resistance Hold?TRX is going for a re-test at $0.12352, which could allow gathering strength to breach the $0.12809 resistance.
A successful breakout of $0.12809 could catapult TRX towards the $0.13549 mark.
A decline beneath $0.11969, the key daily support, will amplify bearish pressures to $0.10416.

TRX - Inverse head and shoulder - Breakout ImminentBINANCE:TRXUSDT (6H CHART) Technical Analysis Update
TRX is currently trading at $0.12346 and has formed a inverse head and shoulder pattern. Price is currently around the resistance line, if see a resistance breakout then we have potential for a good LONG Trade.
I will wait till we have a confirmed breakout of the resistance and enter the long trade only after that.
Entry level: $ 0.12461 (Candle Close above this)
Stop Loss Level: $ 0.11752
TakeProfit 1: $ 0.12778
TakeProfit 2: $ 0.13172
TakeProfit 3: $ 0.13764
TakeProfit 4: $ 0.14398
Max Leverage: 5x
Position Size: 1-2% of capital
Don't forget to keep stop loss.
Follow Our TradingView Account for More Technical Analysis Updates, | Like, Share and Comment Your thoughts.
Cheers
GreenCrypto

TRX Daily Signalling a drop for CryptoLooking at $0.108 for a buy on TRX here, and a Short on Daily close confirmation

TRXUSDT Trading OpportunityTRXUSDT has recently broken out of a bullish pennant structure and an inverse head and shoulders pattern.
This suggests a potential upward movement in the price. The target for the inverse head and shoulders pattern is indicated on the chart, with the neckline serving as the buy-back zone. Additionally, the extended target is based on the potential pole estimation.
It's important to note that technical analysis is just one aspect of trading decisions, and other factors should also be considered. Your engagement and feedback on this analysis are appreciated.
Thank you for your attention to this analysis!

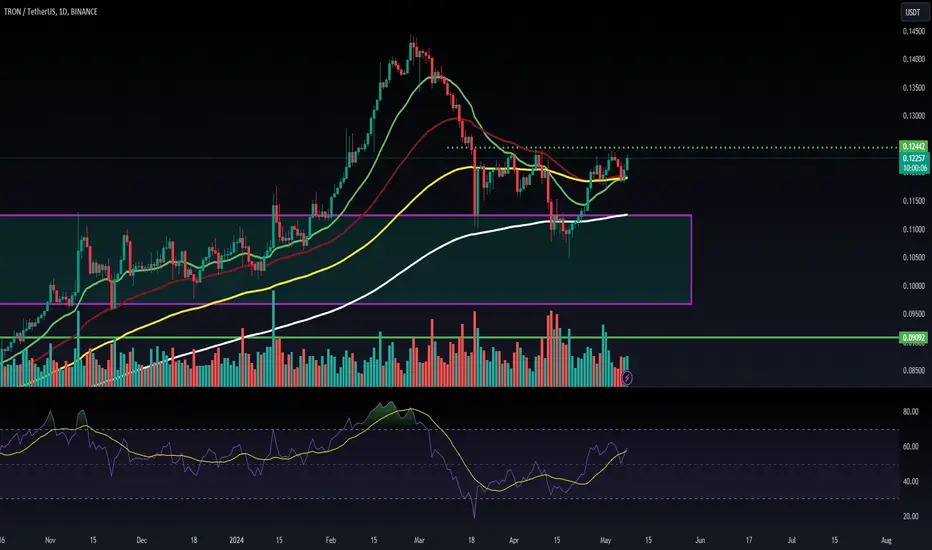
TRXUSDT.1DAnalyzing the daily chart for TRX/USDT, several key technical indicators and support/resistance levels can help inform trading decisions.
Key Resistance and Support Levels:
Resistance 1 (R1): $0.14599 - This level currently acts as the immediate resistance. A breakthrough this point could signal bullish continuation.
Resistance 2 (R2): $0.18044 - This represents a higher target and previous peak that could act as a significant barrier.
Support 1 (S1): $0.09421 - Serving as the nearest support, this level has seen historical price interactions that suggest it might offer substantial buying interest if retested.
Support 2 (S2): $0.04774 - A lower support level, indicating a substantial drop from current levels, yet important in the case of a major bearish turnaround.
Technical Indicators:
Relative Strength Index (RSI): The RSI at 59.87 is moderately high, suggesting that there is still some upward momentum left before reaching overbought conditions (RSI of 70).
Moving Average Convergence Divergence (MACD): The MACD line is above the signal line and both are trending upwards, indicating current bullish momentum. However, the proximity of the lines suggests a potential for volatility or a trend change if they start to converge further.
Trend Analysis:
The chart demonstrates a significant upward trajectory following a recent bullish momentum. The key will be whether TRX/USDT can sustain this momentum and break through the resistance at R1. The overall trend from the lows indicates a strong recovery and potential for further upside if the broader market conditions remain favorable.
Conclusion:
Given the bullish indicators and the price's recent behavior, TRX/USDT might be positioned for further gains if it can breach the immediate resistance at R1. Traders might consider taking long positions near current levels or on small retracements towards S1, setting a stop-loss below this support to manage risk.
Conversely, a fall below S1 might suggest a bearish shift, potentially exposing the next support level at S2 for testing. Continuous monitoring of the RSI and MACD will be crucial, as these will provide early signals for any loss in momentum or potential reversals. As always, external factors such as market sentiment and news should also be taken into account to align with overall crypto market trends.

TRXUSDT → Realization of bullish pattern + golden cross BINANCE:TRXUSDT is forming the break of the descending wedge structure, which in general activates the realization of the bullish pattern
On W1 the price is testing one of the key global levels. Consolidation of the price above 0.1184 will be a confirmation of global bullish intentions. Alitcoin has not yet updated the intermediate and global high, which generally determines the long-term prospects for us.
A breakout of 0.12189 range resistance could be a good signal for growth continuation.
Support levels: 0.11788, SMA
Resistance levels: 0.12189
SMA are forming a cross on H4, which is generally a positive signal. A retest of the range resistance may lead to its breakout and further growth to 0.14500.
Regards R. Linda!


Alikze »» TRX | Wave 3 or C bullish scenarioIn time 2W, after an ascending wave and a double correction at the bottom of the channel, after successfully exiting the concentration, it is moving towards the specified targets. This upward wave is due to the structure in wave 3, whose micro waves will be presented in the next updates. But this upward move will have the ability to reach at least $0.58 and $1.2 in the long term. If no candlestick penetrates below 0.5177, this analysis will be valid for the specified purposes.
🟩Sup:0.097
⛳️Tp 1:0.177
⛳️ Tp2 : 0.58413
⛳️ Tp3 :1.23008
»»»«««»»»«««»»»«««
Please support this idea with a LIKE and COMMENT if you find it useful and Click "Follow" on our profile if you'd like these trade ideas delivered straight to your email in the future.
Thanks for your continued support.
Sincerely.❤️

TRXUSDT UPDATE#TRXUSDT
UPDATE
Hey all friends and traders. Hope you are enjoying our analysis. we are here to analyze TRXUSDT today.
Running as Expected 15% profit done✅
Expecting more in coming days🚀

TRXUSDT - Cup & Handle - Bullish ContinuationBINANCE:TRXUSDT has formed bullish divergence and cup & handle pattern (bullish continuation pattern) indicating imminent bullish momentum! Buy at current market price!

Tron TRX price steadily moving up step by step#TRXUSDT price has been showing a clear, probably ‘artificially maintained’ upward trend since the beginning of 2023.
And even now, the AMEX:TRX price is showing a greater rebound than CRYPTOCAP:BTC
What do you think, what is the chance that the #Tron price will show growth to at least $0.14 in the next 1-2 months?
_____________________
Did you like our analysis? Leave a comment, like, and follow to get more

TRON PriceThe TRON (TRX) coin directs buyer accumulation and trades close to the prompt hurdle of $0.1300. The coin price is poised for an up move and is looking bullish on the charts.