Next Week Target and SupportsLet's take a look at the technical anylasis for XAUUSD
shared a chart for the reference
Futures market

LONG GOLDDespite the heavy news of losses this weekend, Gold has not lost hope to remit bulls.
Trade safe and wisely. All the best

XAUUSD - SHORT (40$ MOVES)XAUUSD - SHORT (40$ MOVES)
look for sell setups and enter, risk small and always use SL, there is uncertainty in the world, so gold can shout up too, risk small and trade with care.
V.Ragu

XAUUSD May 21, 2024 Will the price continue to increase?Hello everyone, DEEKOP is ready to bring the most accurate signals and assessments to everyone.
Financial freedom is true freedom.
The war between Russia and Ukraine has not yet found a voice at the negotiating table, plus President Putin's recent visit to China further shows that Russia will not make concessions to Nato. And recently both Russia and Ukraine rejected the French president's call for a ceasefire during the Olympics in Paris on May 17. These moves further demonstrate tensions in the geopolitical situation
The US economy, after a long period of maintaining high interest rates to control inflation, has led to a situation where the economy is showing signs of weakening, although it is not yet in a recession, but with the leading economic index falling. of the US fell 0.6% MoM in April following an uncontrolled 0.3% decline in March. Weaker consumer outlook on business conditions, weaker new orders , negative interest rate differentials and falling new construction permits fueled April's decline. It suggests weaker US economic conditions going forward.
With such potential risks, Gold will continue to set new ATHs until the above conditions are resolved.
Use the Elliot wave principle to evaluate the situation on the H1 chart
- Yesterday gold created a new ATH at 2450, this is the target area of wave 5 that we launched.
- Then the price dropped to 2408 and recovered slightly to 2436, so we have the current gold price in the ABC correction wave.
- Looking at H1, we see that wave a and wave b are likely to have completed and currently the gold price is completing wave c of the correction.
- The expected price range of wave c has 2 target areas: area 2397 and area 2381, this is the target for the end of wave c.
Plan to trade when the price approaches the 2397 or 2381 zone
Note: Sufficient TP, SL to be safe and win the market‼ ️Change data plan will be updated later.
Deekop's analysis is only a personal opinion with a desire to share its views with the community. I'm not always right. But my analysis always reflects my meticulous evaluation of what is best for an investment.

FALL IS NEAR !!hello welcome back .
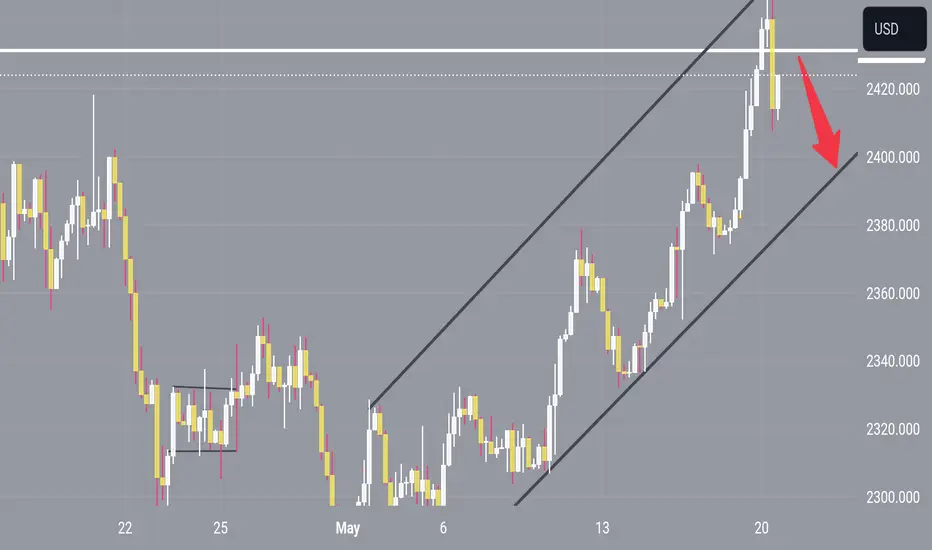
new week start lets analysis gold for this week . last week gold was bullish and buyers were strong .market made an ascending channel and broke 2400 level and also descending channel in weekly time frame market made a side way range for a few weeks now price reach to the top of the channel and strong resistance i expect a good reaction to this level soon wait for a good fall in h4

CHART BREAKDOWN XAUUSD: Key Levels, Targets and Thoughts!🎯Brief Description🖊️:
The chart provides insights into critical market levels, emphasizing an essential supply/demand zone (low-risk sell/buy zone) spanning from 2440 to 2443 and 2384.5 to 2382.5. Additionally, medium-risk buy zone between 2402-2400, respectively, are highlighted.
Things I Have Seen👀:
Important Supply Zone🟢: Identified between 2440 and 2443, serving as a low-risk sell.
Important Demand Zone🟢: Identified between 2384.5 and 2382.5, serving as a low-risk buy.
Medium-Risk Buy Zone🟠: Noted between 2402 and 2400, suggesting another area with moderate risk for potential buying positions.
Bullish Targets📈:
2388: Possible retracement area.
2396: Possible retracement area.
2400: Possible retracement area.
2420: Significant supply zone.
Ultimate Target: 2450- Liquidity area.
Bearish Targets📉:
2437: Possible retracement area.
2424: Possible retracement area.
2407: Area with laying low liquidity.
2402: Essential Demand Zone
Ultimate Target: 2386- Laying Low Liquidity
What's Important Now❗
Currently, the crucial approach is to wait and observe the price action at this level. We need to assess how the market reacts before considering any decisive moves. Stay observant and responsive to real-time developments in the market.

THE KOG REPORTTHE KOG REPORT:
In last week’s KOG Report we said we would be looking for price to attempt the push up, go into resistance where we wanted to short the market into the order region, and then look for the long trade back up from there on the RIP into the levels above. This went extremely well giving us a pin point move from level to level. During the week we updated the idea, which was already going to plan with a new bullish bias level and trade the new Excalibur activations upside into just below where we are now.
Plan worked well again giving an almost pip to pip, level to level reaction from our levels and following our bias and analysis posted pre-hand.
Well done to those that followed not only gold but the numerous other pairs we trade in Camelot which also gave us fantastic results for the week.
So, what can we expect in the week ahead?
This week we would say caution on long trades unless we get a pullback into key level support where we feel it’s worth a test, unless the higher levels aren’t taken on or during the early sessions of the week. We have an order region sitting above 2425-35 which is a large region, and if we see price attempt and give us a clean reversal there, we feel an opportunity to short the market is available for traders back down into the 2400 and below that 2385 price region which is where they may want to start to accumulate again. The issue we have here is that 2445-65 level which is a clean region of liquidity if they want to take it and stretch the sellers even more, so here we will caution again, as that level is the extension of the move, be prepared!
So, in practice what do we do?
Because we’re back in uncharted territory again, we’ll have to treat this as level to level play, we’ll look lower in the highlight region to go long, unless broken, and if they continue to take us up, we’ll trade it level to level looking for the ultimate short trade following our trusted guide.
KOG’s Bias for the week:
Bullish above 2395 with targets above 2430-35 and above that 2447
Bearish on break of 2395 with targets below 2375
It’s going to be a difficult week with potential of gaps on opening due to a Powell speech later, be fore market open! There is a lot of geopolitical news driving the markets and fear is present, although it’s looking like we’re going higher we would say caution over the week as a sudden turn will be extreme!
Please do support us by hitting the like button, leaving a comment, and giving us a follow. We’ve been doing this for a long time now providing traders with in-depth free analysis on Gold, so your likes and comments are very much appreciated.
As always, trade safe.
KOG

Gold gann GridHello Dear Traders,
Wish you a good Day,
on The chart important Levels "Horizontal levels" Based Works as Support/Resistance
Watch for Price action around those levels.
also there are gann grid the green/red trends works as close as Channels in your regular Classic analysis.
Trade around the levels and be as close as possible to take action around it.
Produced by Jinny Gann Ar.
Best Regards

xauusdwhat if 5th has just finished? 2.618 of wave 1 we have a perfect count ending at a multi decade tl. very much of opinion we have 3k on cards but this cannot be ignored! 50% 62% would be targets

Natgas - rebound phase - shortI want to be honest..
The rally long was a surprise for me, I expected a long phase but without this momentum.
It was really strange because we have a big storage increase more than last year and I expected a long phase but more flat.
so I think now we can have a rebound of price until support area more or less 2$ before the last long (if we will have).
The doubt if we have close or not the wave C ..
In any case I try a short position with small size and small risk.
Stop 2.8$
target 2$


Trading requires courage, short gold firstGold has been rising all the way to new highs. After gold hit a high near 2450, it encountered resistance and fell back. The strength of the rise has weakened. In the short-term trend, the top shock has obviously narrowed. In the short-term, it may re-choose its direction. Moreover, the technical level deviates from the technical indicators, and gold has a need for a correction. I don’t think it makes much sense to continue chasing gold at high levels now. Even if we want to be long gold, we have to wait for gold to pull back and stabilize.
Therefore, in terms of trading, do not easily chase gold at high levels. Gold continues to rise, and the energy of bulls needs to be released. So now it is either a quick adjustment to release, or a long period of sideways trading, exchanging time for space to release. So in terms of short-term trading, I prefer to short gold, and I have already done so.
Trading requires courage and even more decisiveness. Execution is the only criterion for profitability. Regret is meaningless.I share detailed trading strategies and trading signals every day. You can follow the channel at the bottom of the article to get detailed trading signals and learn trading logic. People who are already in it have already made a lot of money. Let us enjoy the journey of making money together. !

GOLD corrects, uptrend remains stable, market newsOn the Asian market, gold is delivered immediately OANDA:XAUUSD suddenly dropped sharply from the session's high of 2,433.13 USD/ounce. Gold price has just touched 2,410 USD/ounce, setting the lowest level of the day as of the time this article was completed.
News of the death of the Iranian president has increased tensions in the region and gold prices have increased due to safe-haven demand. However, comments from Federal Reserve Vice Chairman Michael Barr put pressure on gold prices.
Barr, the Fed vice chairman for regulatory affairs, said Monday that interest rates will need to remain at current levels for longer to bring inflation back to the sustainable target level. “The Fed needs to give tightening policy more time to continue to work,” Barr said.
New geopolitical news in the Middle East
New news from the Middle East situation on May 20, the prosecutor of the International Criminal Court applied for an arrest warrant for Israeli Prime Minister Netanyahu and Defense Minister Galante on suspicion of war crimes.
According to the prosecutor's statement, prosecutors have "reasonable grounds to believe" that Prime Minister Netanyahu and Israeli Defense Minister Galante are responsible for the "war crimes and counterattacks" that occurred. in the Gaza Strip “from at least October 8, 2023”.
Traders are monitoring developments in the Middle East after Iran's president and foreign minister were killed in a helicopter crash. Additionally, in Saudi Arabia, OPEC's largest oil producer, King Salman is being treated for a lung infection.
In general, the market is lacking truly notable developments that create significant fluctuations, so gold is likely to correct, but in terms of the overall picture, although gold prices are limited in their upward momentum by comments from officials. Fed, but it still has a lot of fundamental room to increase prices.
Analysis of technical prospects for OANDA:XAUUSD
On the daily chart, gold has corrected significantly from its new all-time high set yesterday, a correction that was also price point to the 0.382% trend-following Fibonacci extension.
However, the gold price still has an uptrend mainly from trend and a short-term uptrend from price channel and all the support and technical conditions support the possibility of price increase.
Once gold breaks the 0.382% Fibonacci extension level, it will continue to open a new bullish cycle with a new era high targeted at the 0.50% Fibonacci point.
As long as gold remains above the original price point of 2,400 USD and the 0.236% Fibonacci level along the price channel, it still has short-term bullish prospects.
During the day, the uptrend in technical gold prices will be noticed again by the following price levels.
Support: 2,400 – 2,398USD
Resistance: 2,422 – 2,430USD
🪙SELL XAUUSD | 2457 - 2455
⚰️SL: 2461
⬆️TP1: 2450
⬆️TP2: 2445
🪙BUY XAUUSD | 2389 - 2391
⚰️SL: 2385
⬆️TP1: 2396
⬆️TP2: 2401

GOLD GO DOWN Hey there on 4hTF The Gold can touch 2430 and then will see downside 2396 so we can now wait for again touch 2430 and forward to sell area
Gold Sell (66pips)After the Gold bullish rally, we find ourselves in a bearish pressure. Price Action is observed, this is only a trade idea. Use proper risk management. Happy Trading OANDA:XAUUSD FOREXCOM:XAUUSD TVC:DXY

SILVER (XAGUSD): Massive Breakout 🪙
Silver went up rapidly on Friday,
violating a massive psychological resistance cluster.
With a high probability, the broken structure turned into support.
The market has a nice potential to go higher after a pullback.
Next resistance - 34.0
❤️Please, support my work with like, thank you!❤️

XAUUSD SELL BREAKOUT TRENDLINEHere on gold price has breaking the trendline and now moving down so the targeting profit should be at psychological level of 2400.000

GOLD Shortterm view is still BEARISH today!on the long run is still sideways and bullish. but today is BEARISH!
watch your risk management. Good Luck.
i try to always we will keep you all updated . Please don't forget to like, comment and follow to support me, i really appreciate you support !
i'll help you to have a great trade.
Please using good money management.
dont take any emotional trade.
Note:
Dont risk more than 0.2% on trending market
Dont risk more than 1% on ranging market
Wish good luck for all people.
Please help support me by Clicking like button, and if you like my ideas please follow me and support me. i Relly Appreciate it!
i'll make more and more great analysis if this chanel grows.
on Gold, eurusd, gbpusd and oil specially.
what do you think?
please comment and rate below.
Thankyou.

OIL - Getting Slippery?🩸Hello TradingView Family / Fellow Traders. This is Richard, also known as theSignalyst.
📉 After breaking below the last major low marked in red at $84.5, OIL has been overall bearish , trading within the rising channel in blue.
📈 For the bulls to regain control, a break above the last major high marked in blue is needed.
📚 Meanwhile, OIL would be bearish and can still trade lower to test the $75 - $76.25 support zone.
📚 Always follow your trading plan regarding entry, risk management, and trade management.
Good luck!
All Strategies Are Good; If Managed Properly!
~Rich

Golden Doomsayer judgment is that inflation still highGold prices traded higher midafternoon on Wednesday as a report showed US inflation is still high.
Gold for June delivery was last seen up, again near US$2,400 per ounce.
The US Bureau of Labor Statistics on Wednesday reported the April consumer-price index rose by 0.3% from March.
Shelter, gas prices remain sticky.
Notable call-outs from the inflation print include the shelter index, which rose 5.5% on an unadjusted, annual basis, a slowdown from March. The Shelter index (the largest US CPI component with near 32% weight) rose 0.4% month over month and was the largest factor in the monthly increase in core prices, according to the BLS.
Sticky shelter inflation is largely to blame for higher core inflation readings, according to economists.
In technical terms, Gold prices are on positive path, firmly above 26- and 52-weeks SMA, while 50/200-weekly SMA Golden Cross that occurred in 2017, still works pretty well, helps year after year to robust gain in yellow metal.
Technical perspectives are near 2550 and 2800 per XAUUSD ounce in this time.

🚨 XAU/USD Selling Strategy - 15M Chart Analysis 🚨Hey traders, we’re seeing some movement on the XAU/USD pair on the 15-minute frame. Let’s break down the key points:
✅ Entry: We’re targeting an entry for a short position around the $2430.14 resistance level, marked by recent rejections and the alignment with the 21 EMA (yellow line). Watch for bearish price action signals around this area as confirmation.
❌ SL (Stop Loss): To safeguard the trade, place the stop loss just above the $2436.73 mark, where we see the higher 4-hour resistance line. This gives us room to avoid small whipsaws.
🎯 TP (Take Profit): Our first target is at the $2416.62 level, where previous support has been tested. If momentum persists, extend the target to the next significant 4-hour support at $2407.00.
The current setup shows XAU/USD making lower highs while pressing down on a support zone, suggesting a potential drop if the support fails. Keep an eye on these levels and ensure your risk management is dialed in! Stay cool, trade smart! 📉👍

Gold price entered the adjustment period after create a new peakGold prices continued to decline on Tuesday, completely covering the recovery phase after the pullback from the $2,450 mark. However, gold remains supported by rising expectations of a Fed rate cut, ongoing geopolitical tensions, along with strong demand from central banks and Asian buyers.
The daily chart of the XAU/USD pair favors an extension to the upside, as the pair trades above all of its moving averages. In fact, the 34 Simple Moving Average has modest upward traction at around $2,340, while the longer moving averages point further north than that. Furthermore, technical indicators are all moving higher near overbought levels with no signs of exhaustion.
Gold prices hit a new record high early Monday hitting $2,450. The precious metal fell in price during the US trading session, mainly due to profit-taking, as the USD did not fluctuate much. The USD traded gloomy on the foreign exchange board due to a lack of new information from the economic calendar.
Gold price is approaching the important level 2407 which determines the next trend of gold.
Plan May 21
Support: 2401 - 2391 - 2379
Resistance: 2431- 2442 - 2453 - 2458 - 2473
Breakout and retest: 2431 - 2407
SELL price range 2454 - 2456 stop 2460
BUY price range 2392 - 2390 stop 2386

Daily live trade with XAUUSD in 15m/30m/1h 20240520Daily live trade with XAUUSD in 15m/30m/1h 20240520
