Breakout - Pullback - Resumption1. Prices break support to the upside
2. Prices make a bearish pullback
3. Prices rebound upwards
Conclusion: Bullish figure, continuation not impossible
Forex market

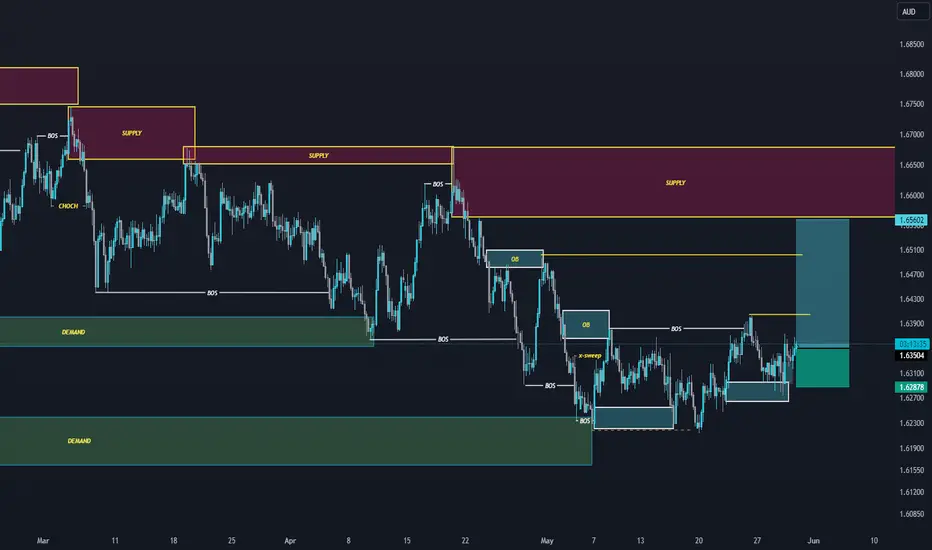
AUDUSD - 2 of 2 sell trade and last possible transaction according to the analysis,
as we can see, we have a bearish orderflow, so it makes sense to take this sell

AUDNZD SidewaysAUDNZD is not making any clear higher highs or lower lows, therefore support and resistance trading strategies are suitable

EURAUD = BUY Accumulation phase from a 4H demand, this is a signal for a potential reversal to fill up all the manipulation move that sold aggressive to the demand📊✔
EURJPY : SET FOR A CORRECTION- The market has been registering higher highs and lows since beginning of May ; the short-term trend is then bullish.
- The sharp market rally that saw prices climbing 4.14% higher from 164.000 to 170.800 seems to be losing momentum.
Indeed, the bearish divergence displayed by the RSI indicator, and the fact that new highs were registered with less and less strength tends to indicate a trend slowdown here.
Since the impact below 170.800, sellers have taken control of the market, in a price action also fueled by take profit moves.
The market now trades slightly above the 169.33/169.18 zone, the first major short-term support for prices.
The RSI now evolves far below its 50% level, while the moving averages are reversing to the downside.
- It is hard to say if the correction will continue deeper or if the market will keep on rebounding over the 23.6% Fibonacci zone for now.
However, in the even of a break-out of the 169.33/169.18 level, a new bearish potential towards 168.18 and 167.38 would be unlocked.
That said, tomorrow's EU CPI figures should bring more market volatility, especially as investors already anticipate firmer inflation numbers.
Pierre Veyret, Technical Analyst at ActivTrades
The information provided does not constitute investment research. The material has no been prepared in accordance with the legal requirements designed to promote the independence of investment research and such is to be considered to be a marketing communication.
All information has been prepared by ActivTrades ("AT"). The information does not contain a record of AT's prices, or an offer of or solicitation for a transaction in any financial instrument. No representation or warranty is given as to the accuracy or completeness of this information.
Any material provided does not have regard to the specific investment objective and financial situation of any person who may receive it. Past performance is not reliable indicator of future performance. AT provides an execution-only service. Consequently, any person acing on the information provided does so at their own risk.

EURCHFEURCHF is in strong bullish trend.
As the market is consistently printing new HHs and HLs.
currently the market is retracing a bit after last HH, which is 62% Fib retracement level and local support as well. if the market successfully sustain this buying confluence the next leg up could go for new HH.
What you guys think of this idea

EURGBP Buy ideaThe long position in EURGBP is initiated at the current market price of 0.85100, reflecting the favorable risk-reward profile. The first target is set at 0.85325, aligning with the entry point and representing an initial profit-taking opportunity. Subsequently, the second target is established at 0.85663, encompassing the potential upside trajectory based on comprehensive technical and fundamental considerations.

GBP/JPY ( Short )Hi traders.
It's looking like this pair is heading lower. Intraday trade. In and out. I'm waiting on the lower timeframes for a bearish chart pattern for entry.

USDCAD: Day 3 cycle, First Red DayHi everyone and welcome to my channel, please don’t forget to support all my work subscribing and liking my post, and for any question leave me a comment, I will be more than happy to help you!
“Trade setups, not movements”
1. DAY OF THE WEEK (Failed Breakout, False Break, Range Expansion)
Monday DAY 1 Opening Range ✅ Day 3 cycle
Tuesday DAY 2 Initial Balance
Wednesday DAY 3 (reset DAY 1) Mid Point Week
Thursday DAY 2
Friday DAY 3 Closing Range
2. SIGNAL DAY
First Red Day ✅
First Green Day
3 Days Long Breakout
3 Days Short Breakout
Inside Day
3. WEEKLY TEMPLATE
Pump&Dump ✅
Dump&Pump
Frontside
Backside ✅
4. THESIS:
Long: secondary, after the dump of Friday, the market can consolidating down low into the current LOD, going to stop short trader in profit from previous HOW
Short: primary, Monday to Friday possibly built order flow for a potential quick short move into the LOW, where trader long bought for a whole week
Please note that the purpose of my analysis is to help me and you hunting the best trade setup for the day, none of my technical aspects are a way to forecast any directional market movement.
Gianni

GBPJPY: Day 3 longs breakout traders in the marketHi everyone and welcome to my channel, please don’t forget to support all my work subscribing and liking my post, and for any question leave me a comment, I will be more than happy to help you!
“Trade setups, not movements”
1. DAY OF THE WEEK (Failed Breakout, False Break, Range Expansion)
Monday DAY 1 Opening Range
Tuesday DAY 2 Initial Balance
Wednesday DAY 3 (reset DAY 1) Mid Point Week ✅ Day 1 cycle
Thursday DAY 2
Friday DAY 3 Closing Range
2. SIGNAL DAY
First Red Day
First Green Day
3 Days Long Breakout
3 Days Short Breakout
Inside Day
3. WEEKLY TEMPLATE
Pump&Dump
Dump&Pump
Frontside ✅
Backside
4. THESIS:
Long: secondary, considering this market still (at the moment) on the frontside move, it could keep going higher if price drop at least on the LOD;
Short: primary, CP to LOD can be an interesting scalping opportunity if the market keep consolidating around the CP level.
Please note that the purpose of my analysis is to help me and you hunting the best trade setup for the day, none of my technical aspects are a way to forecast any directional market movement.
Gianni

GBPUSD: Day 3 breakout traders long in the marketHi everyone and welcome to my channel, please don’t forget to support all my work subscribing and liking my post, and for any question leave me a comment, I will be more than happy to help you!
“Trade setups, not movements”
1. DAY OF THE WEEK (Failed Breakout, False Break, Range Expansion)
Monday DAY 1 Opening Range
Tuesday DAY 2 Initial Balance ✅
Wednesday DAY 3 (reset DAY 1) Mid Point Week
Thursday DAY 2
Friday DAY 3 Closing Range
2. SIGNAL DAY
First Red Day
First Green Day
3 Days Long Breakout ✅
3 Days Short Breakout
Inside Day
3. WEEKLY TEMPLATE
Pump&Dump
Dump&Pump ✅
Frontside ✅
Backside
4. THESIS:
Long: primary, today is Tuesday day 2, typically the market expands the range, Asia place a higher high and dumped down, starting consolidating, there a possibility to see a high low range extension for 100% at leat of the range.
Short: secondary, price anyway is at the current HOW, it could give a short scalp HOW to LOW if setup correctly
Please note that the purpose of my analysis is to help me and you hunting the best trade setup for the day, none of my technical aspects are a way to forecast any directional market movement.
Gianni

GBP/USD not backing down despite rejection at 1.28GBP/USD turned bearish on Wednesday after being rejected at 1.28 the day prior. It’s not the first time the pair has been rejected at that level which suggests it has become somewhat of a psychological barrier, at which buyers need to show increased commitment to overcome.
The reversal came in part due to the uptick in the US dollar, but other GBP pairs also struggled for momentum. Hawkish commentary from FOMC members has been reviving the rally in the dollar in recent weeks after struggling to catch bids for most of the past two months. Neel Kashkari, President of the Federal Bank of Minneapolis, said on Tuesday: ‘I don’t think anybody has totally taken rate increases off the table. I think the odds of us raising rates are quite low, but I don’t want to take anything off the table.’ This is just the latest of a list of comments from Fed speakers that have led markets to write off hopes for rate cuts this year. Rate cut odds have dropped from six 25 bps cuts in 2024 at the beginning of the year, to just one, now expected between November and December. But if data continues to show resilience, these odds will likely decrease further.
The realisation that the Federal Reserve was not going to start cutting as soon as the new year came around was the key driver behind the strength in the US dollar during the first four months of the year, as rate differentials played in favour of the US currency. But expectations of rate cuts have been pushed back elsewhere too, including in Europe and the UK. This led to re-adjusted rate differentials as overnight index swaps started to price out rate cuts from the ECB and BoE, weighing on the dollar and allowing the likes of EUR/USD and GBP/USD to recover some bullish momentum.
Looking ahead, the primary catalyst for USD pairs will be the PCE index data released on Friday. The figure is expected to remain mostly unchanged following its year-long trend but any surprises could create some volatility. Continued pushback in rate cut expectations in the US could solidify the reversal in the dollar, weighing on GBP/USD.
The pair seems to be holding onto some bullish appetite as Wednesday’s pullback deepened during the Asian session on Thursday but quickly reversed higher as traders came online in London on Thursday morning. GBP/USD is now contained just below the 61.8% Fibonacci (1.2718) awaiting further momentum to break higher. The current setup suggests the path of least resistance remains higher with any pullbacks expected to be technical corrections with limited uptake as long as the pair remains above 1.2643. Beyond this level, the ascending trendline from the April 22 and May 9 lows could offer support around 1.2620, before the next Fibonacci comes into play at 1.2588.

GBPUSDAnalysis of GBP
Time frame of 4 hours
From these ranges, the price can drop to the range of 26,500

Some Of My Entries And Reasons , How I Made +2000 Pips ?This Is An Educational + Analytic Content That Will Teach Why And How To Enter A Trade
Make Sure You Watch The Price Action Closely In Each Analysis As This Is A Very Important Part Of Our Method
Disclaimer : This Analysis Can Change At Anytime Without Notice And It Is Only For The Purpose Of Assisting Traders To Make Independent Investments Decisions.

GBPCHF - 4hrs ( Sell Trade Target Range 150 PIP ) ☑️Pair Name : GBP/CHF
Time Frame : 4hrs Chart / Close
Scale Type : Large Scale
------
⚙️ spreading knowledge among us and to clarify the most important points of entry, exit and entry with more than 5 reasons
We seek to spread understanding rather than make money
🔗 Key Technical / Direction ( Short )
Type : Mid Term Swing
———————————
🛡Bearish Break
1.16200 Area
Reasons
- Major Turn level / D
- Inner Channel Break
- Bearish Choch Zone / weekly
- Fibo Golden Zone
- Day / week low
🛡Bullish Reversal
1.14700
Reasons
- Major Turn level / M
- Fibo Time Zone
- Choch Area
- Pattern Area
- Quarter's Area
- Fibo Golden
- Visible Range HVN
- Fixed Range Hvn

GBP NZD - AnalysisAnalyzing the chart will wait until we break the neckline to confirm head and shoulder pattern. It also has some bullish divergence.

AUDUSD BUYHi fellow traders, AUDUSD is ready to make a move higher from the blue box after completing the correction. Target the 0.6751 level and move your stoploss to break even as soon as we reach the ‘Risk free zone’. Good luck and trade safe!

USDCHF SELLHi fellow traders, USDCHF is ready to make a move lower from the blue box after completing the expanding flat pattern. Target the 0.8948 level and move your stoploss to break even as soon as we reach the ‘Risk free zone’. Good luck and trade safe!

trade in lower timeframe structure ⚠️Do not act based on my analysis, do your own research!!
Learn from my experience, with all the mistakes and pain shared on the way to the main goal - consistency. I'm always glad to discuss and answer questions.
Most likely, the buyers' strength will not be enough to pass the resistance.
If you are a day trading you can use my H4 Idea for market direction in 15 minutes trend.

USDCHF Will Go Up From Support! Long!
Take a look at our analysis for USDCHF.
Time Frame: 12h
Current Trend: Bullish
Sentiment: Oversold (based on 7-period RSI)
Forecast: Bullish
The price is testing a key support 0.907.
Current market trend & oversold RSI makes me think that buyers will push the price. I will anticipate a bullish movement at least to 0.915 level.
P.S
Overbought describes a period of time where there has been a significant and consistent upward move in price over a period of time without much pullback.
Like and subscribe and comment my ideas if you enjoy them!

CADCHF Short Term Sell IdeaH1 - Bearish trend pattern
No opposite signs
Until the strong resistance zone holds I expect the price to move lower further after pullbacks

NZDJPY NZDJPY price is near the important resistance zone 96.67. If the price cannot break through the 96.67 level, it is expected that there is a chance that the price will decline. Consider selling in the red zone.
>>GooD Luck 😊
❤️ Like and subscribe to never miss a new idea!

EURCHFWe can attempt to short EURCHF from specified level as it break HL , also there is bearish divergence indicate that it moved downward.
SL , TP mention in chart.
