MasterAnanda
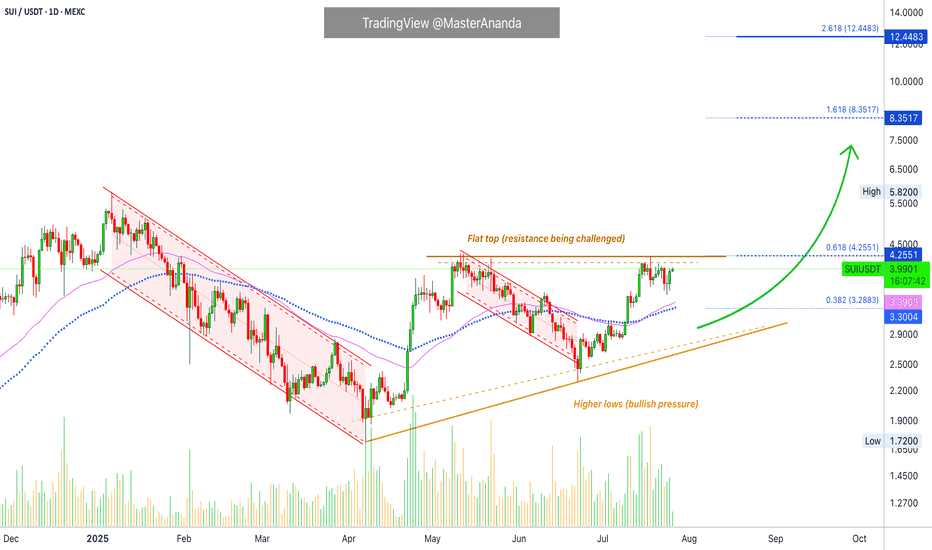
PremiumThis is a nice chart. It is well structured. It is also basic and standard. You can know where a project is at based on the drawings (patterns) on the chart. When you look at hundreds of charts, for years, you can see the signature of the trading bots on each chart. Each exchange has a different set of algorithms doing the trading. It is fascinating to say the...
A flat bottom is bullish because support can be confirmed as found when sellers (bears) fail to move prices past a certain point. A flat bottom produces the double-bottom and triple-bottom reversal signals. When the bottom is flat, depending on the phase the market is going through, we can easily say bullish. A flat top is not bearish, it is a completely different...
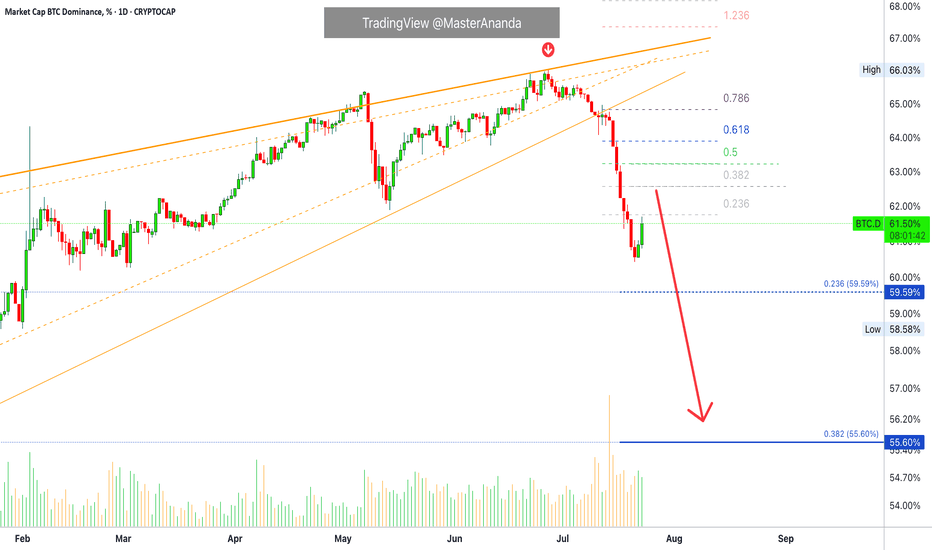
Bitcoin Dominance produced a bullish trend that was more than 1,000 days long. While this was a major development, the action never happened just straight up. There were always fluctuations. Bitcoin Dominance broke out of a major rising wedge pattern. A pattern that lasted years in the making. Recently, Bitcoin Dominance produced the highest bearish volume...
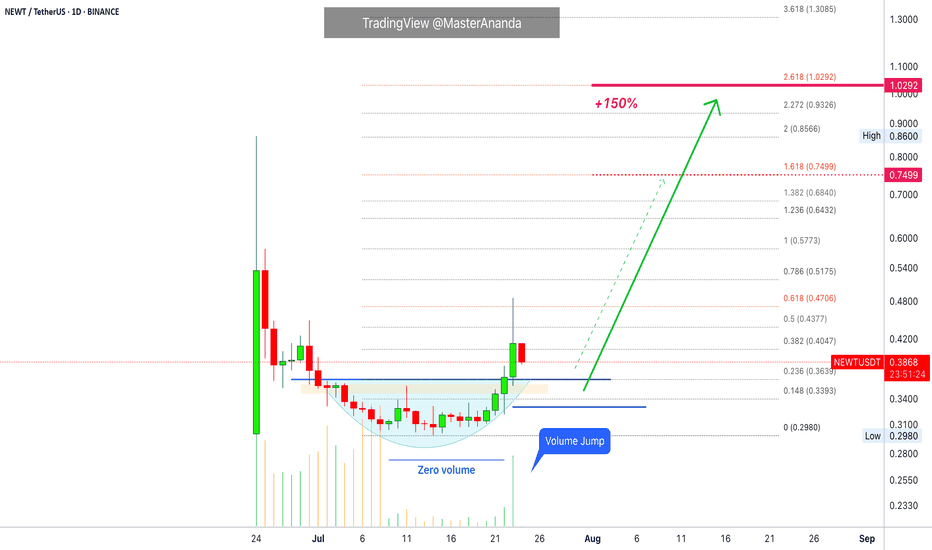
I will show you now a successful choice on a volume signal as we look at Newton Protocol (NEWTUSDT) on the daily timeframe. Notice how trading volume is flat while NEWTUSDT is producing a rounded bottom with the daily candles. It reads "zero volume" on the chart. Now notice the strong "volume jump" today, 23-July, as soon as the action moves outside the rounded...
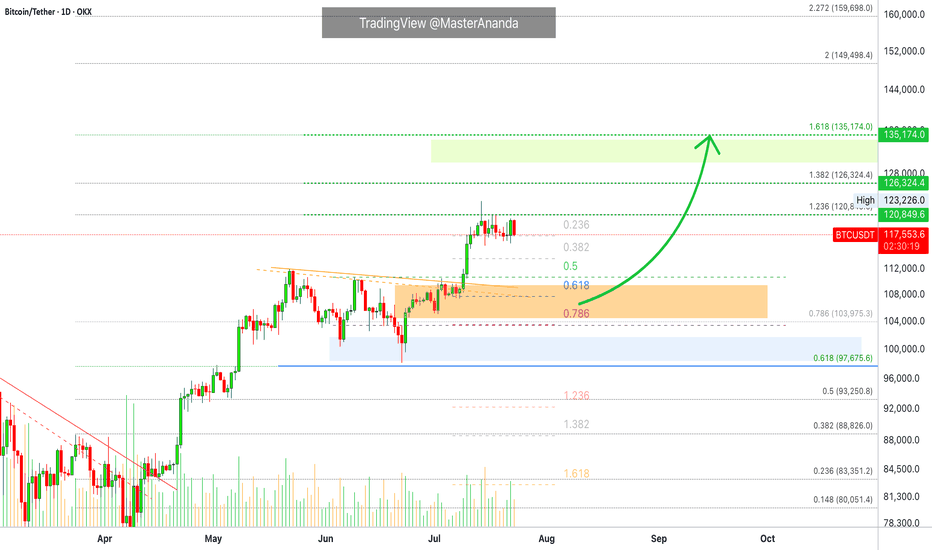
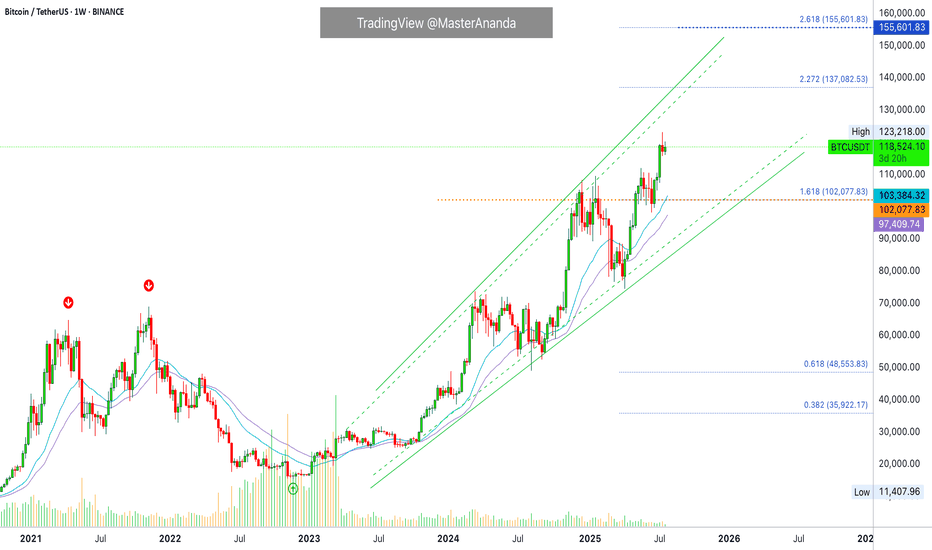
Bitcoin just hit a new all-time high recently and is consolidating just below resistance. I have a question: How far down can Bitcoin go on a sudden retrace? That's a great question. Assuming that Bitcoin will continue growing mid-term and long-term, we can expect some more consolidation before higher prices. A retrace is not mandatory but is possible. A...
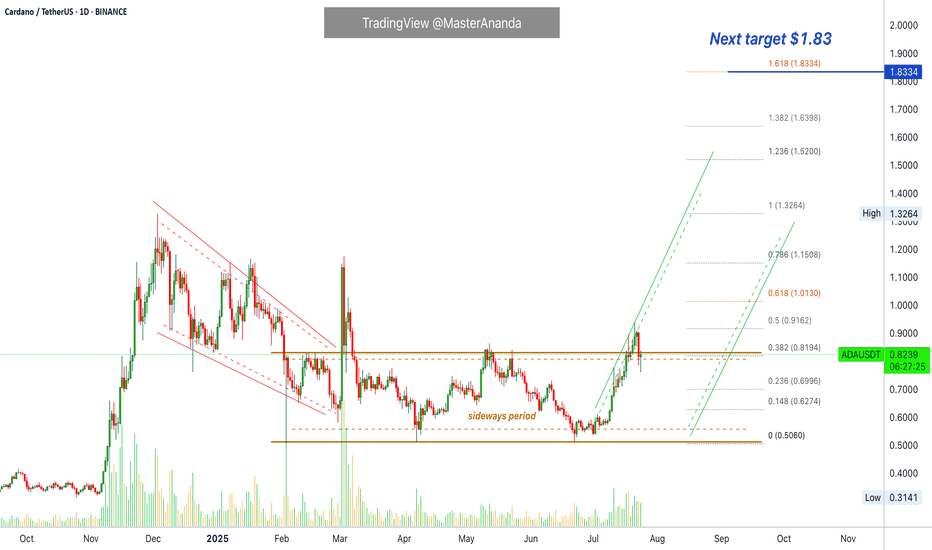
Cardano's all-time high is $3.10. Cardano is currently trading at $0.82. Pause. You will be a genius when ADA is trading at $4 if you decide to buy below $1. It is not too late. This is only the start. Good afternoon my fellow Cryptocurrency trader, how are you feeling in this wonderful day? The first major advance for Cardano after the last bull market happened...
League of Kingdoms has been dropping since March 2022 vs Bitcoin, LOKABTC. A more than 3 years strong downtrend. The chart is telling me that this downtrend is coming to an end. We have a volume signal, together with price and marketwide action. Growth potential is huge, it goes beyond 3,700%. For this chart setup, we are going to be focusing only on the...
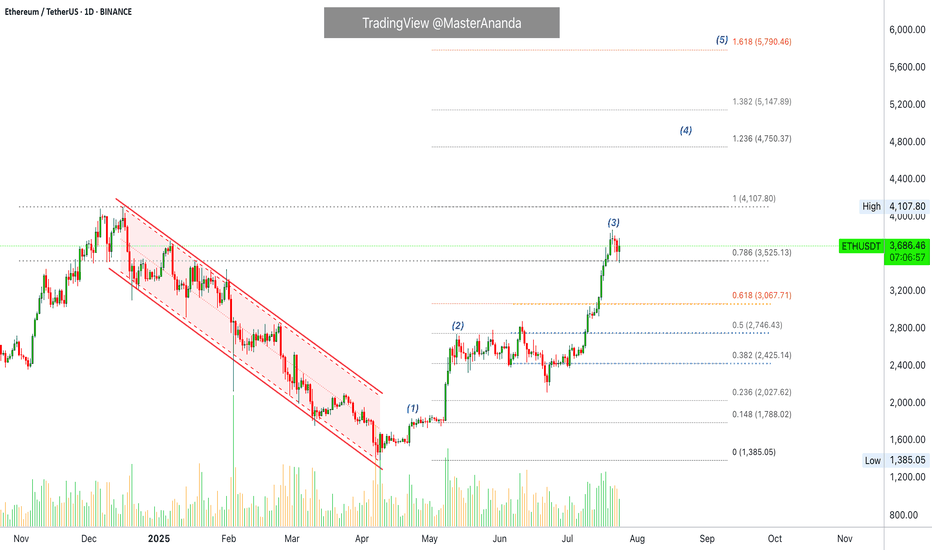
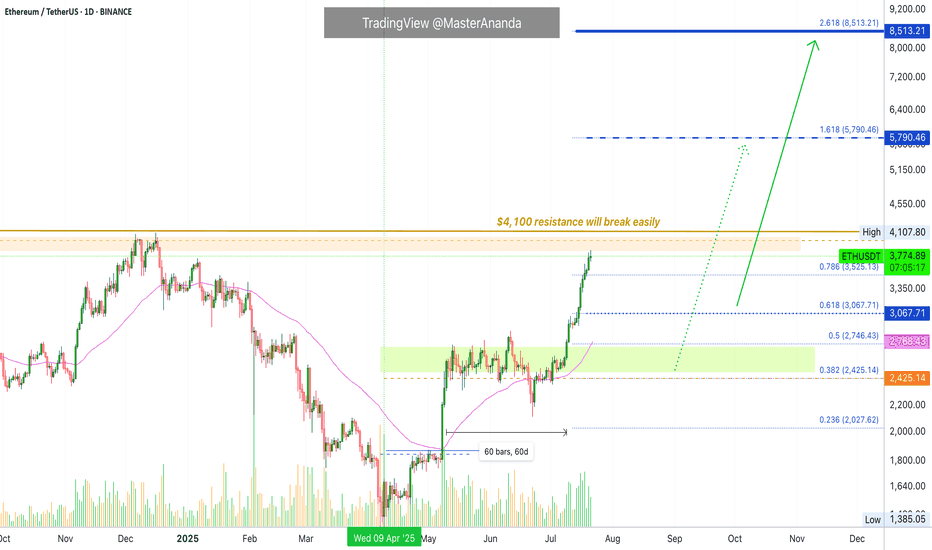
Ethereum started its latest bullish on the 9th of April. Each advance has been preceded by a period of consolidation. ETHUSDT (Ether) recovered from its bottom range 23-April, immediately it went sideways for 14 days before moving forward (1). As soon as Ethereum reached $2,700, we have the same pattern but extended, more sideways before moving forward. See this...
There won't be a correction for Bitcoin. Not now, not yet. The reasons why I already explained in several earlier publications that predicted the current scenario. The bullish breakout that is from the long-term consolidation range. That's the reason, that's the reason why Bitcoin will not go lower without first going higher. Since Bitcoin consolidated for 7...
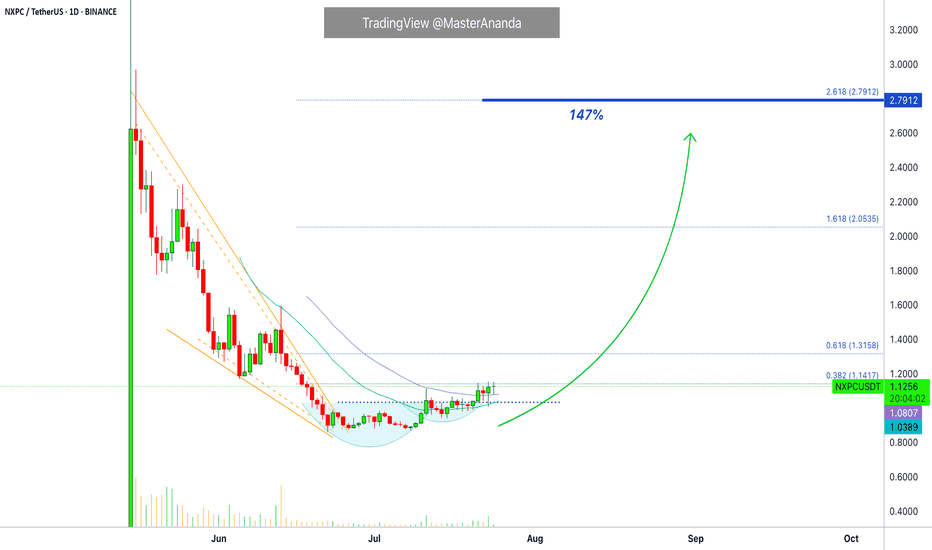
Here is another trading pair that is trading low and will produce nice growth (profits) in the coming weeks and days. Nexpace (NXPCUSDT). This one is better than some of the others because it has lower risk. The risk is lower because the action is happening out of the bottom range but prices are still very low. Low prices but with an early bullish bias...
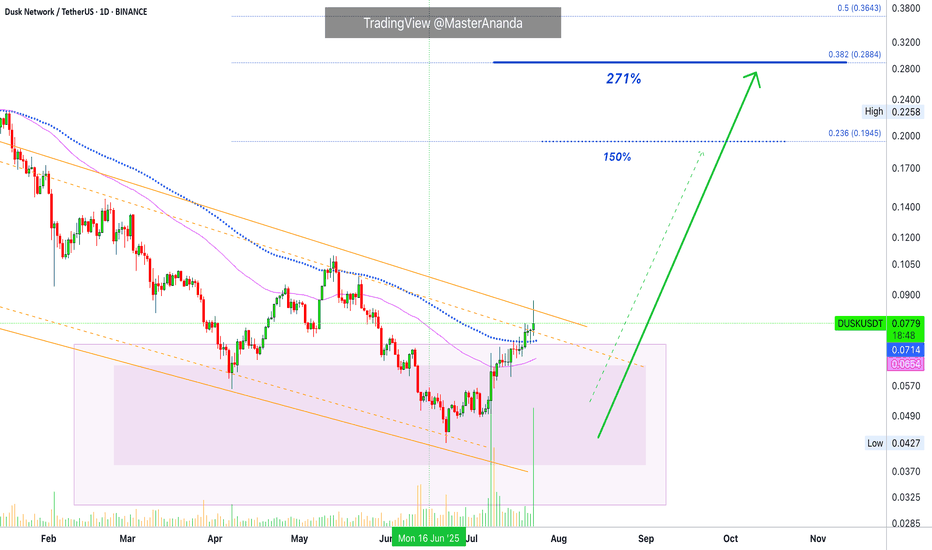
This is a complete setup, I shall explain. Trading long-term vs trading short-term and technical analysis. We are looking at Dusk Network (DUSKUSDT) on the daily timeframe. You know how I always look for the bottom and trend reversal for all major pairs for long-term trade-numbers; but, when focusing on the short-term you want a fully confirmed setup rather than...
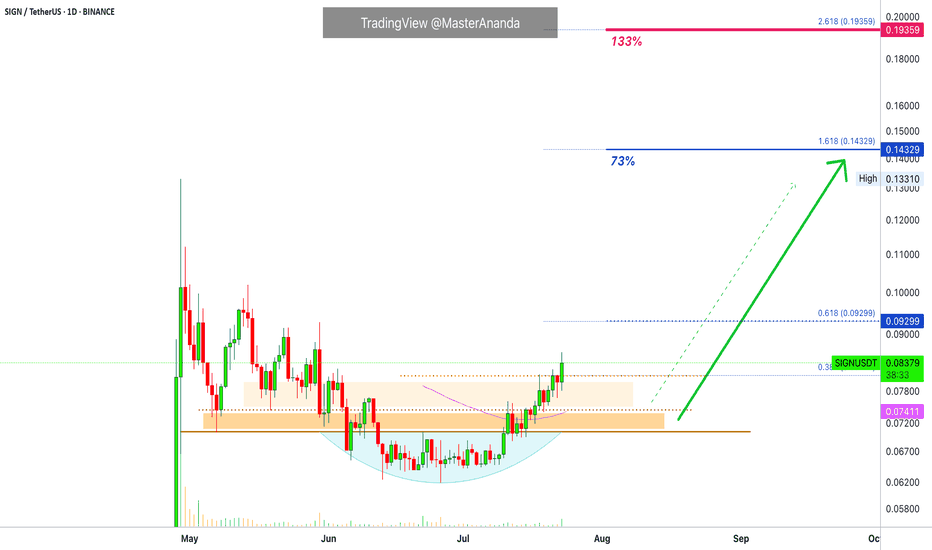
The same chart, the same dynamics and the same highly profitable easy to win trading opportunity. The main low happens 7-May. There are lower prices after this but this is the stop-loss hunt event. We know this based on the rounded bottom pattern. SIGNUSDT is back above its 7-May low and also trading above EMA55 on a daily basis. Above EMA55 after hitting a...
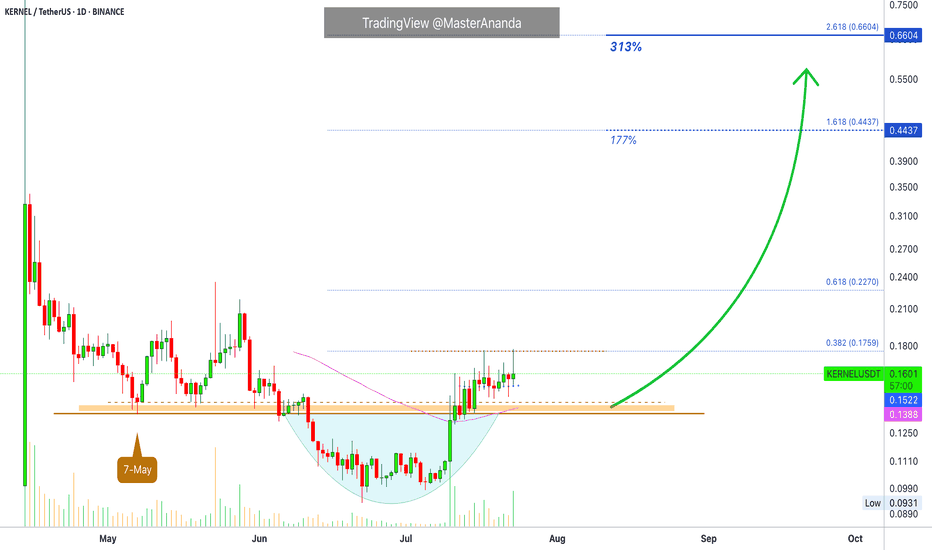
This is another strong chart setup. I am looking at the short-term because that is the request I am getting from many of my followers. People are interested now in growing their capital so this can be used to accumulate strong reputable projects later on. Something like double-up, triple-up then grow some more. When enough cash is available; sit back, relax and...
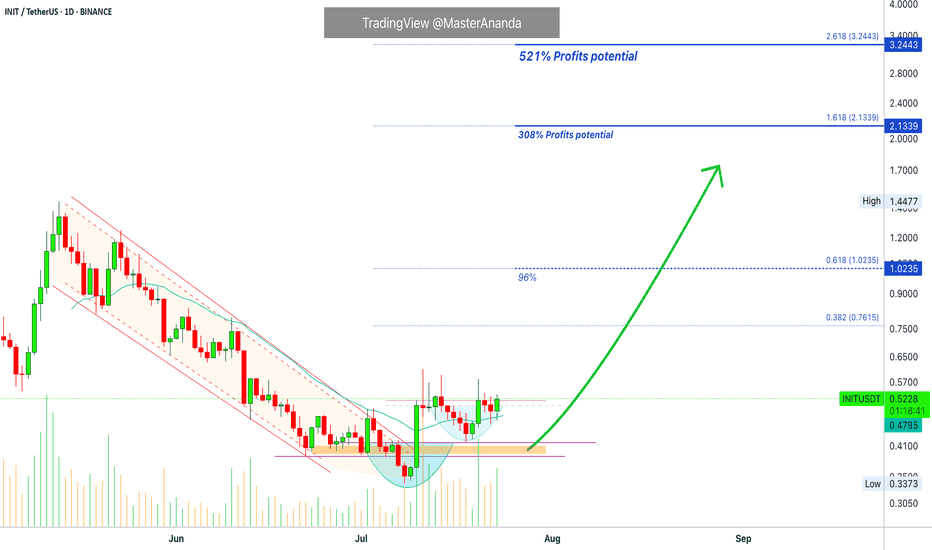
Here we have a nice chart setup and we are aiming for 144% short-term followed by 300%+ potential profits. Initia—INITUSDT—broke out of a downtrend 10-July with a full green candle and is already trading above EMA21. This is a solid, easy and simple chart setup. Notice how the new projects continue moving forward while some of the big projects are stalling or...
Ok. Straight up has been confirmed but as you already know, the market never moves straight down neither straight up. It seems Ethereum is about to take a small break. This shouldn't alarm you nor be a concern, we are set for sustained long-term growth. When bullish momentum dies down, the market tends to take a break, a pause, before additional growth. Please...
I had to update this chart. It took longer than usual to move and this is always the case. Whenever we plan for 3 days we end up having to wait 10 days. If we plan to wait patiently for two weeks then the wait lasts six weeks and so on. Just be prepared to hold long-term and this can yield better results. No time, just get in when prices are low and hold. This...
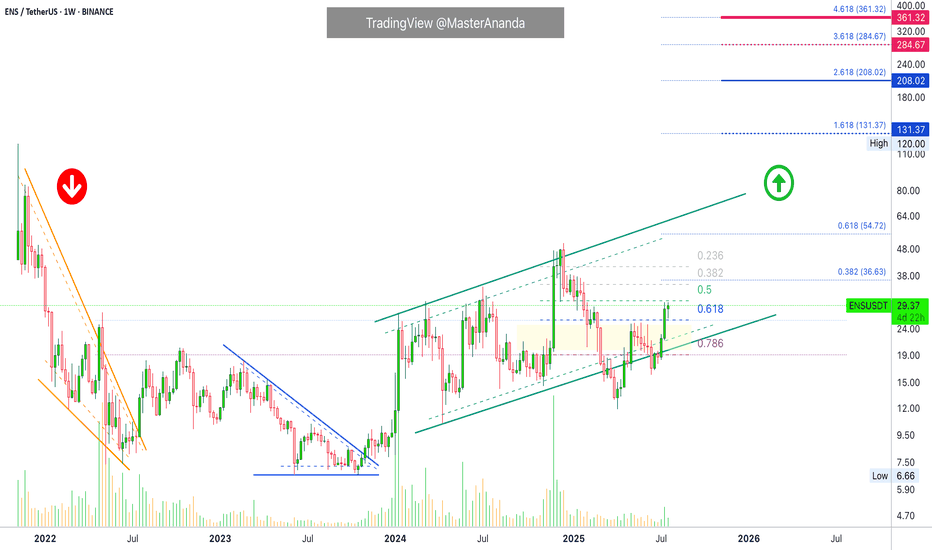
Ethereum Name Service really took off in late 2023. March 2024 did nothing to this project. Here we can see an extended period of higher highs until December 2024. Many projects produced a major high in March 2024 to turn bearish until recently. In December, all of these produced a lower high. You can see how different this chart looks. This is a strong project...
Stacks all-time high was hit April 2024. This ATH comes as a long-term double-top because it happened within the same November 2021 peak price range. After a major wave there is always a correction. A correction can happen in any direction. If the trend is bearish, the correction is an up-move. If the trend is bullish, the correction is a down-move. Very...


