Important section: 1071.36-1130.53Hello, traders.
If you "Follow", you can always get new information quickly.
Please click "Boost" as well.
Have a nice day today.
-------------------------------------
(1M chart)
The key is whether the price can be maintained by rising above the Fibonacci ratio 3.618 (1135.97), which is the peak of the major uptrend.
If not, it is expected to form a downtrend and form a new trend.
(1W chart)
The Fibonacci ratio on the right is shown in the major uptrend.
The Fibonacci ratio on the left is shown in the recent uptrend on the 1W chart.
Accordingly, if the price is maintained above the right Fibonacci ratio 3.618 (1135.97), it is expected to rise to the left Fibonacci ratio 1 (1339.36).
The important section on the 1W chart is around 848.46.
Accordingly, if it fails to rise above 1130.53, it should check for support near 848.46.
The rising channel indicated by the circle is a trend line connected between lows.
Therefore, if it cannot rise within the current rising channel, the key is whether it rises along the rising channel between lows indicated by the circle.
(1D chart)
The HA-High indicator on the 1D chart is showing signs of being created at the 1071.36 point.
Accordingly, the important section on the 1D chart is around 1071.36.
Therefore, the section 1071.36-1130.53 is the important section.
This volatility period is around June 4th (June 3rd-5th).
Therefore, it is necessary to check in which direction it deviates from the section 1071.36-1130.53 after the volatility period.
Have a good time.
Thank you.
--------------------------------------------------
- Big picture
It is expected that a full-scale uptrend will start after it rises above 29K.
The section expected to touch in the next bull market is 81K-95K.
#BTCUSD 12M
1st: 44234.54
2nd: 61383.23
3rd: 89126.41
101875.70-106275.10 (overshooting)
4th: 13401.28
151166.97-157451.83 (overshooting)
5th: 178910.15
These are points where resistance is likely to occur in the future.
We need to check if these points can be broken upward.
We need to check the movement when this section is touched because I think a new trend can be created in the overshooting section.
#BTCUSD 1M
If the major uptrend continues until 2025, it is expected to start forming a pull back pattern after rising to around 57014.33.
1st: 43833.05
2nd: 32992.55
-----------------


June 2: Downside to correct Oct 2022 rallyNYSE:DELL in Monthly finished May with a big red candle on high volume below the channel. The May top combined with a huge drop with bearish RSI divergence on the weekly increases the possibility that it was a climax top and the 5-wave rally from Oct 2022 has finished. The gap left on the monthly is another clue that the last run to the May top was an exhaustion gap and would be a magnet for the pull back to retest the 100 psychological level.

NVDA likely wave pattern with FibsUsing elliot wave corrective 4-5 of 12345 to pull back to about 1000 . may be weaker pull back too another fib, then wave 5 pulse move up to about 1250 Golden Ratio. Then we get abc further into future after. Of course general market correction can interrupt this in mid August

Nice entry point for PYPL Paypal - Long termPayPal was bearish since Sep 2021 till Oct 2023 (2 full years).
It seems like it has hit the bottom at $50 area, and now making a bullish trend (higher low, higher high).
It broke the down trend line from Aug 2022, and currently making a confirmation.
$63 price at the beginning of June 2024 is a good entry point for the long run with relatively short stop-loss (less than 5%)
Target points are as below:
6 months : +21%
1 year later : +48%
1.5 years later : +84%
2.5 years later : +175%
4 years later : +359%
So, we can check with PayPal every 0.5 year (6 months).
GL

COIN Alternative View - Massive Move IncomingA different chart from what I posted earlier for COIN, there's always several different angles. But one thing remains the same, this chart also looks incredibly bullish. I expect COIN to be a top performer in the next 2-3 months if BTC and NQ continue to rally.
If it can break above $286, COIN is over $100 away from my next target at $368.90 and over $200 away from ATH. I think it may take a while for ATH, but I do think the $368.90 level could be hit this year, and relatively soon. It depends on what NQ and BTC do, but I expect a breakout like this to lead to an extended rally over the course of 2-3 months at least.

HRTX - Biotech long play Heron Therapeutics Inc is a commercial-stage biotechnology company. It is focused on improving the lives of patients by developing treatments that address some of the unmet patient needs. The company's product portfolio consists of APONVIE, SUSTOL, ZYNRELEF, and CINVANTI.
Investment Snapshot (As of May 31, 2024):
Shares in Circulation: 116.291M
Short Float: 26.03%
Recent Activity:
Blockbuy
Active Stake
Heron Therapeutics Submits ZYNRELEF® Supplement to FDA
Key Technical Levels:
Breakout Zone: $3.70 - $4.00.
Note: A slight pullback to the $3.50 area is possible before moving higher.
Resistance Points:
$4.00
$4.50
Surpassing these levels could signal a positive trend. Consider taking profits at these stages to realize gains.
Trading Strategy:
Take Profit (TP): Target $4.50 or even $5.50 to capitalize on the anticipated price gap closure.
Stop Loss (SL): Set at under $3.15 to mitigate potential losses.
Chart Analysis:
Please refer to the attached chart for detailed analysis of price trends and movements.
Trading Advisory:
Exercise caution and consider market conditions and your own risk tolerance when trading. It's advisable to conduct comprehensive research or consult with a financial advisor before engaging in trading activities.
Disclaimer: This content is for informational purposes only and should not be considered financial advice.

QBTS - Quantum Computing Company - Huge PotentialD-Wave Quantum Inc is engaged in the development and delivery of quantum computing systems, software, and services, and is also a commercial supplier of quantum computers. It delivers customer value with practical quantum applications for problems as diverse as logistics, artificial intelligence, materials sciences, drug discovery, scheduling, cybersecurity, fault detection, and financial modeling. Geographically, it derives the majority of its revenue from the United States.
News:
D-Wave Quantum Inc. is poised to enter the Russell 3000® Index, marking a significant milestone for the company’s visibility in the stock market. This inclusion, taking effect at the start of trading on July 1st, 2024, reflects the company’s growth and the potential for increased investor interest. The announcement, released on May 28, 2024, underscores D-Wave’s evolving status within the broad-market index.
Recent block buy
Key Technical Levels:
Current Price Analysis: The stock is at a very low price, presenting potential growth opportunities. Scaling in could be a prudent strategy.
Resistance Points:
$1.80
$2.00
$2.40
$3.20
$4.40
Surpassing these levels could signal a positive trend, providing opportunities to take profits at these stages.
Trading Strategy:
Take Profit (TP):
First target: $3.20
Second target: $5.30
Stop Loss (SL): Set at below $1.10 to mitigate potential losses.
Chart Analysis:
Please refer to the attached chart for a detailed analysis of price trends and movements.
Trading Advisory:
Exercise caution and consider market conditions and your own risk tolerance when trading. Conduct comprehensive research or consult with a financial advisor before engaging in trading activities.
Disclaimer: This content is for informational purposes only and should not be considered financial advice.

Support The stock BABA has an interesting support level from this chart. The EMA indicator shows a downward crossover. If the candle breaks below support level 1, it could potentially yield profits on the downside.

Support zone: Around 189.84Hello, traders.
If you "Follow", you can always get new information quickly.
Please click "Boost" as well.
Have a nice day today.
-------------------------------------
(1M chart)
You need to check if it is rising along the rising channel.
The important zone on the 1M chart is around 175.45.
(1W chart)
The important zone on the 1W chart is around 189.42.
Therefore, the support zone is the 175.45-189.42 zone.
You need to check if it is forming a trend while passing through the week including July 22nd and the week including August 19th.
If it falls below 157.65, we need to check for support near 136.72.
(1D chart)
The important sections on the 1D chart are around 189.84 and 172.16.
Therefore, the key is whether it can find support near 189.84 and rise above the Fibonacci ratio of 0.5 (197.89).
If it falls near 189.84 and shows resistance,
1st: 181.99
2nd: 172.16-175.45
We need to check for support near the 1st and 2nd above.
Have a good time.
Thank you.
--------------------------------------------------
- Big picture
It is expected that the real uptrend will start after rising above 29K.
The section expected to be touched in the next bull market is 81K-95K.
#BTCUSD 12M
1st: 44234.54
2nd: 61383.23
3rd: 89126.41
101875.70-106275.10 (when overshooting)
4th: 13401.28
151166.97-157451.83 (when overshooting)
5th: 178910.15
These are points where resistance is likely to occur in the future.
We need to check if these points can be broken upward.
Since it is thought that a new trend can be created in the overshooting section, it is necessary to check the movement when this section is touched.
#BTCUSD 1M
If the major upward trend continues until 2025, it is expected to start by creating a pull back pattern after rising to around 57014.33.
1st: 43833.05
2nd: 32992.55
-----------------

$TSLA Right at Resistance.NASDAQ:TSLA I had an alert set on the Area of Resistance Line on this chart. It triggered this morning and I have taken a ½ size position in anticipation of that becoming support. I do not know if it will play out that way so I have a stop under the 50 DMA (red) which would a 4% position risk. Should it move up and over the resistance area I will look to add. All TBD.
The chart I am using is the All-In-One LevelUp tool available here on TV. Check it out.
Ideas, not investing / trading advice. Comments always welcome. Thanks for looking.

SMCI Long Idea I think SMCI could easily go either way this week depending what NQ and NVDA do. So here's a follow up long idea to my previous short idea. If the market is bullish this could be a great long opportunity if it goes.back to test the trendline it broke out of. This area also has some previous lows for added confirmation. I expect good movement out of SMCI this week either way.

MICRON POSSIBLY RESUME ITS MARK UPBased on Big Picture, currently micron is on going Mark Up Phase
i am interested in the recent price action (Black circle),
which shows contraction
Principle of contraction is one of the topic in which David described in-depth,
in his phenomenal wyckoffian book (Trade About To Happen)
Apart from that, i noticed the presence of SpringBoard (Blue Color)
As such, i initiated position last week (24/5/24)
Position as attached
Thus i stick to my original thesis of Micron (Refer my previous post)
Pure Wyckoff

Market update 6/2/2024Just going through the usual updates. I'm mostly doing these videos for myself kind of like a trading journal and also to look back on it later whether I was right or wrong about some things. I don't have notes and I completely improvise it so I probably misspeak sometimes, also that's why there's no structure to what I'm saying, I just talk about what comes to mind. I also want to keep track of my performance, my mindset and the rationale for the trades I'm making. I've been recording these every week for 2 months now but only decided last week to start making them public, so will keep doing that. Not sure if anyone will find it useful, but if I ever become rich, at least I have proof. And if I don't make it and I go broke, then you can also learn from me which is what not to do! But in general, these will probably keep me accountable and disciplined, so I like publishing these.

Chubb (CB): Buffett Buy
Warren Buffett just bought this stock called CHUBB (stock symbol is CB). Here is my chart with a new buy signal on Friday. You can visually see that it will move up. And with Warren Buffett piling in, you have a whale on your side if you throw money at it and hold for the next 5 years.
www.forbes.com

$LLY putting bullish case for $870NYSE:LLY has been capturing obesity market with monstrous growth. Currently it's entering the volume gap. RSI and William% range now showing bullish divergence. My pt is $870.

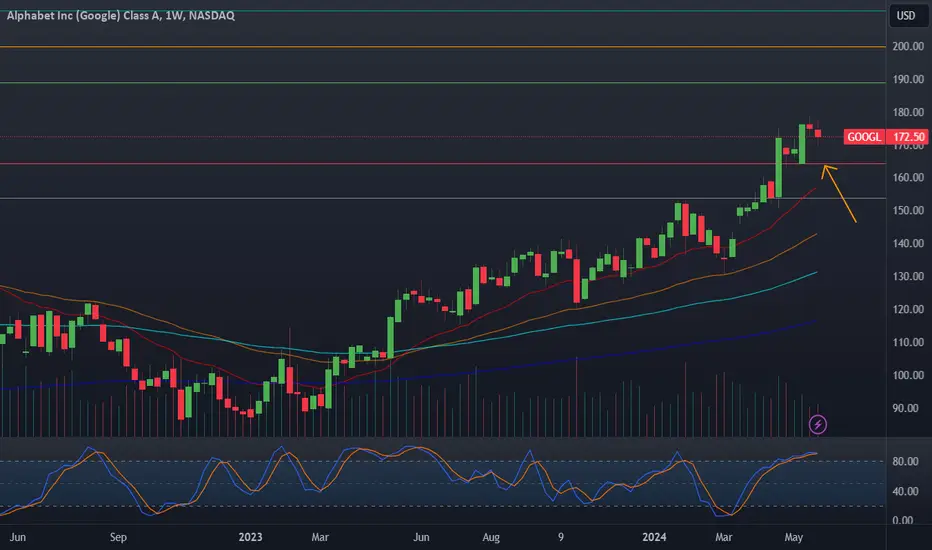
Googl absolute buy zoneGoogl is probably my largest future bet going forward. After the most recent earnings and a very thoughtful analysis, I find it to be the best value of the Mag 7, followed by Amazon. I go with A class shares since they offer voting power and are likely more popular. My plan for this stock is to buy 2026 Jan leaps likely around 150$, and sell covered calls against the position. If I am close to assignment I may roll, or allow the leaps to move. I do plan on exercising at least one of these in 2026 at the 150$ range since I believe this is an amazing company.
-165 UPCOM:ISH is an amazing deal, the company was valued at 164 using discounted cash flow model in Q1
-Low forward PE in an overheated market
-Extremely high cash flows
-Expanding cloud revenue
-Slept on in the Ai market, they control the data, therefore their Ai presence will be huge
-Large moat, people like to use google, youtube, and the cloud is expanding
GOOG Momentum Long *Potential Setup*This is a potential long on GOOG.
The first leg up has happened which is step one of the setup.
Step two is a tight consolidation channel which I am waiting to see.
Step three would be a second leg up.

Home Depot DivergenceHome Depot is a stock that loves bull and bear divergences in technical terms. There have been 3 bullish divergences since 2022, all of which have brought an average return of around 25%. The last divergence is now in place and a potential 25% return would push the stock over $400.

AMD Unveils Ryzen 9000 Zen 5 CPUs: Up to 16 Cores, Enhanced PerfAMD has officially announced the highly anticipated Ryzen 9000 Zen 5 desktop processors, set to launch in July. The flagship Ryzen 9 9950X features up to 16 cores and offers a 16% average IPC increase over its Ryzen 7000 predecessors. These new CPUs bring significant architectural enhancements, including improved branch prediction, wider pipelines, and increased AI performance. Additionally, AMD introduces the X870 and X870E chipsets, supporting PCIe 5.0 and USB4. The combination of powerful new processors and advanced chipsets marks a substantial leap forward in desktop computing. Stay tuned for more updates as the launch approaches.


BBY shortI am bearish for BBY as I see potential bearish pattern here and multiple top. I expect to fall down for BBY

